0.92
⚡ Rill's BI-as-code powers fast dashboards, embedded analytics, and an agent-ready semantic layer — all running on top of the warehouses you already use.
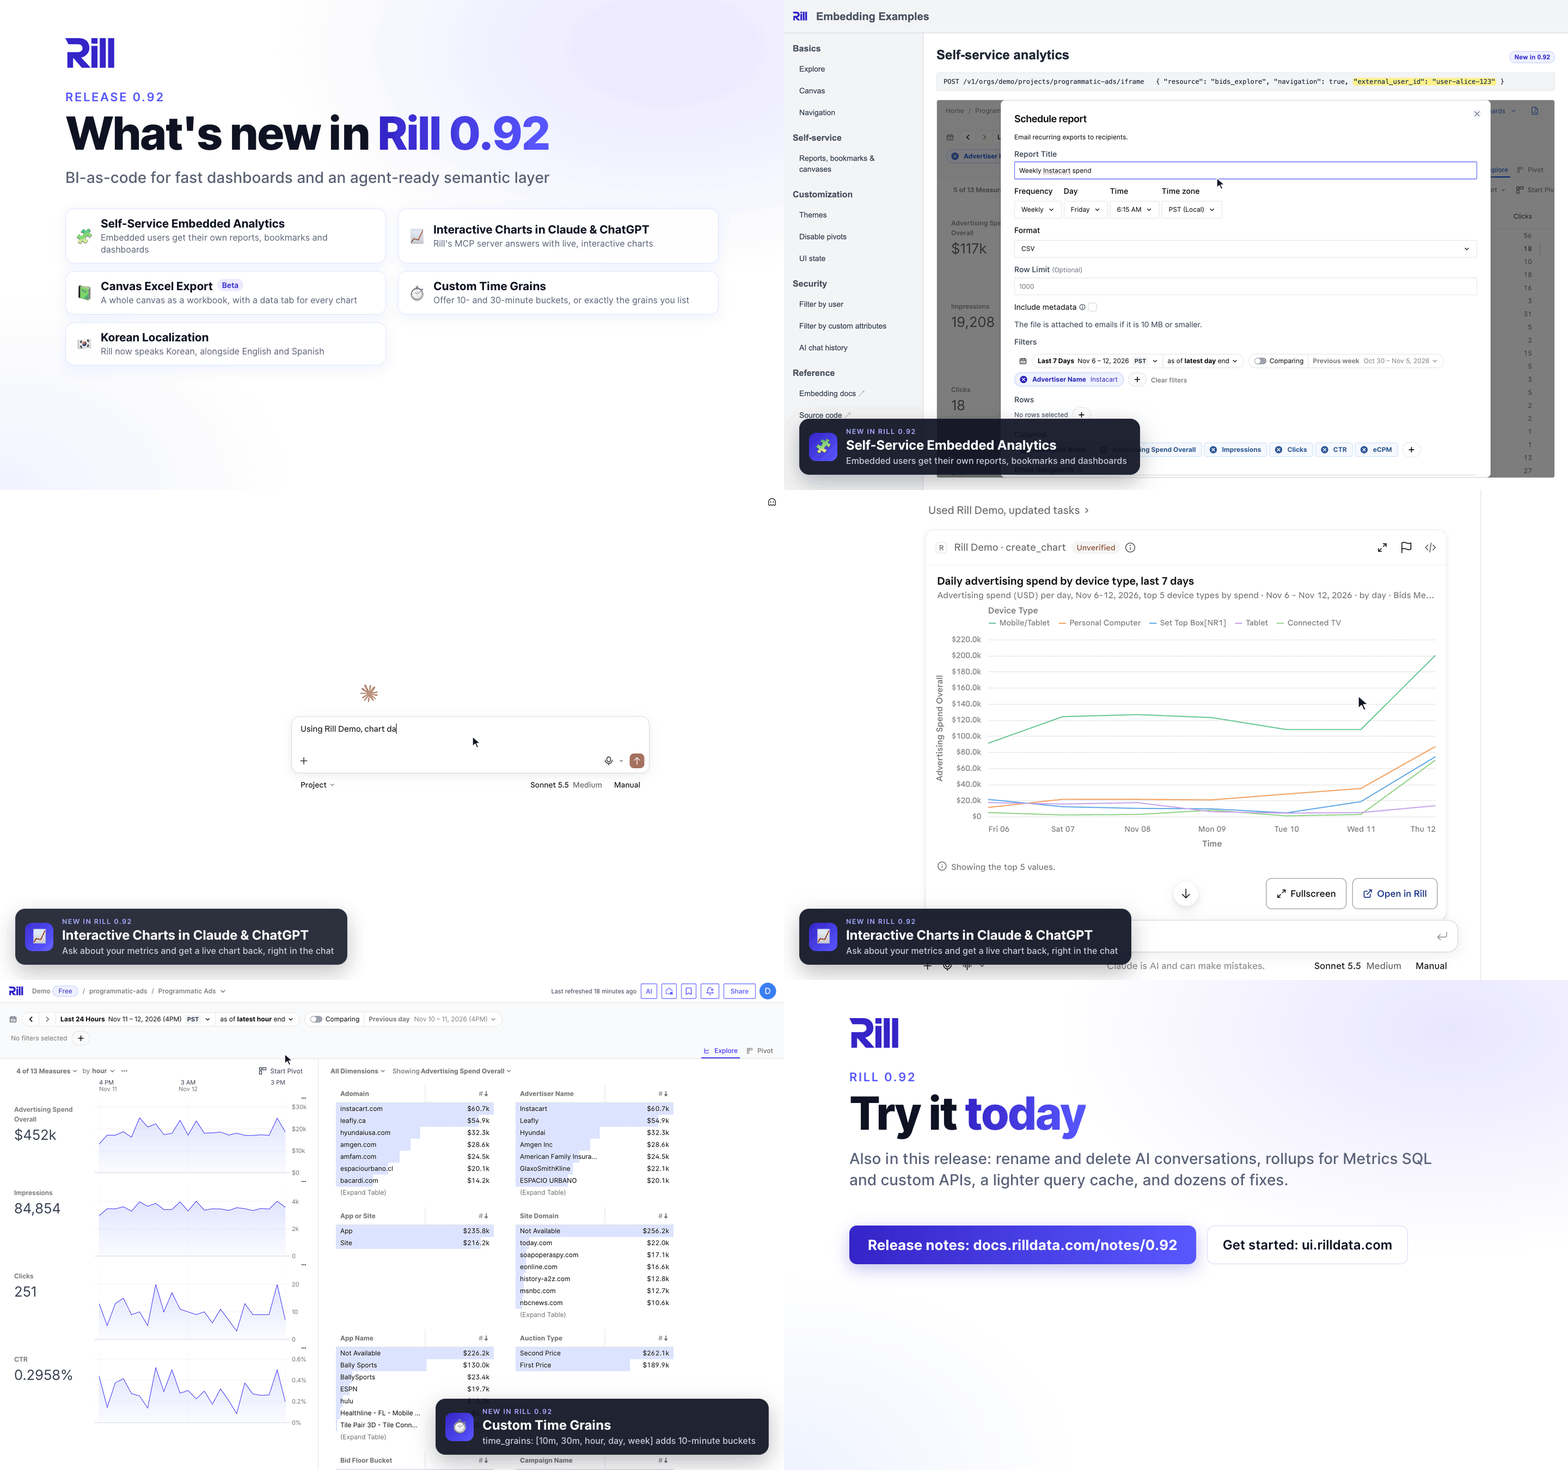
🧩 Self-Service Embedded Analytics
The users of your app can now do more than explore embedded dashboards. When your backend passes an external_user_id to GetIFrame, each user can schedule their own reports, set up their own alerts, build their own canvas dashboards and save bookmarks, all limited to the data your security policies let them see. Each feature is off in embeds by default and is enabled with a feature flag in rill.yaml: set reports, alerts and embedded_bookmarks to true, and personal_canvases to '{{ .user.embed }}' (or true to also enable it in Rill Cloud). Rill Cloud users keep reports, alerts and bookmarks either way.
- Scheduled reports. Embed users can schedule email reports of the explore dashboards they can see from the dashboard's export menu, and manage them from a reports page in the navigation bar. Reports run with the
user_emailorattributesfrom the user's latest iframe, always attach the export, and pause when you haven't requested an iframe for the user in 90 days. Enable them with thereportsfeature flag, whose default is now'{{ not .user.embed }}'. Projects that already setreports: truewill show reports to embed users who have anexternal_user_id. - Alerts. Embed users can create alerts on the explore dashboards they can see, to get an email when a measure crosses a threshold, and manage them from the alerts menu in the navigation bar. Alerts work like embed reports: they run with the user's latest identity, keep the dashboard limits of the iframe they were created in, and pause after 90 days without an iframe for the user. Attaching the rows that triggered an alert is optional. Enable them with the
alertsfeature flag, whose default is now'{{ not .user.embed }}'. Projects that already setalerts: truewill show alerts to embed users who have anexternal_user_id. - Open links back to your app. Set
embeds.open_urlinrill.yaml, and the creator of a report or alert gets an Open in browser link to that page in your app in its emails. The page passes the link'srill_openvalue asopentoGetIFrame, which opens the dashboard in the state the report or alert captured. - Personal canvases (beta). In iframes with
navigation: true, embed users can create, edit and delete their own canvas dashboards from a menu in the navigation bar, and the project home lists them above the shared dashboards. Only their owner and project admins can open them. Enable them with thepersonal_canvasesfeature flag. - Bookmarks. Embed users can save a dashboard's filters and time range as a private bookmark and reopen it later, from the bookmarks menu in the navigation bar, or in the dashboard's top-right corner when the bar is hidden. Enable them with the
embedded_bookmarksfeature flag. - Navigation from the host page. The new
navigatepostMessage method opens a dashboard, the project home, or the user's reports or alerts page in the iframe. - Copying from embeds. The iframe snippets now include
allow="clipboard-write". Add it to your<iframe>so that Shift+Click copies cell values in Chrome and Edge, which block the Clipboard API in cross-origin iframes without it.
Since reports, alerts, canvases and bookmarks are stored per external_user_id, use an ID that identifies one security context, such as <tenant id>:<user id>; see User identity in embeds. IDs can be up to 2,048 bytes long, and GetIFrame rejects longer ones.
📈 Interactive Charts in Claude and ChatGPT
When you ask Claude or ChatGPT about your data through the Rill MCP server, charts now appear in the conversation as interactive Rill charts, with the same rendering, number formats and theme as custom viz components in Rill. In fullscreen, change the time grain, the number of top values or the comparison with the previous period, each re-queried from Rill, or switch the chart type and layout instantly. The chart tells the AI what it currently shows, and Open in Rill opens the same query in an explore dashboard. Charts work on every Rill MCP endpoint, including the unified endpoint and Rill Developer, in clients that support MCP Apps; other clients, such as Claude Code, keep receiving a table and the link. A built-in rill-charts skill guides the AI's choice of chart. Charts are on by default; set mcp_charts: false under features in rill.yaml to turn them off for MCP clients only.
📗 Canvas Excel Export (Beta)
Canvas dashboards in Rill Cloud can now be exported as an Excel workbook from the Export tab of the Share popover, next to the PDF export. The workbook has a dashboard sheet for the canvas, or one per exported tab, laid out like the canvas with its title, time range, filters and an Open in Rill link, plus a data sheet for each chart, table, map, custom chart query and leaderboard dimension, written as an Excel table with typed cells and your measures' number formats. Charts become native Excel charts bound to their data sheets (bar, stacked bar, line, area, pie, donut, scatter and combo) or PNG snapshots; heatmaps, funnels, maps and custom charts are always images. KPIs get their value and sparkline. Canvas Excel export is in beta behind the canvas_excel_export feature flag.
⏱️ Custom Time Grains
A metrics view can now set time_grains to choose the grains its dashboards offer, including multiples of minutes and hours: 5m, 10m, 15m, 30m, 2h, 3h, 4h, 6h, 8h and 12h.
timeseries: event_time
smallest_time_grain: minute
time_grains: [10m, 30m, hour, day, week]
The list replaces the default grains in explore and canvas dashboards, pivot tables and scheduled reports, and the adaptive grain picks only from it. Buckets nest inside hours and days and start at midnight in the dashboard's time zone on every supported OLAP engine. The new grains also work in Metrics SQL (date_trunc('10m', ts)), explore URLs and canvas time_filters. Without time_grains, dashboards keep offering the standard grains at or above smallest_time_grain.
🇰🇷 Korean Localization
Rill is now available in Korean, our second language after Spanish. More than 2,100 strings have been translated, matching the English interface key for key. Rill Developer picks Korean up from your browser's preferred language, and in Rill Cloud you can choose 한국어 from the language switcher in the user menu.
💬 Rename and Delete AI Conversations
Keep your AI chat history tidy. Rename or delete a conversation from the conversation list on the project's AI page, or from the menu next to the conversation title in the chat sidebar. Renaming happens in place and supports @ references to measures, dimensions and metrics views, as in the chat input.
⚡ Performance Improvements
- Rollups for Metrics SQL and custom APIs. Metrics SQL, and so custom APIs built on it, put time filters in
WHERE, which made rollup selection skip every rollup. Rill now moves>=and<bounds on the primary time dimension into the query's time range whenever that leaves the results unchanged, so these queries, and API callers that bound time inwhere, can read from a matching rollup instead of the base table. - Lighter query cache. Sizing a query result for the cache no longer serializes it, which uses about 3.4 times less memory and runs 2.3 times faster per cache miss (2.7 MB down to 0.8 MB for 10,000 rows).
Bug Fixes and Improvements
Explore / Dashboards
- Added a notice above pivot tables in explore and canvas dashboards when columns are left out past the limit of 50 (150 with comparison), and a First 100 shown row at the end of row groups that have more values
- Fixed pivots with a time grain in columns over a long range, such as hours over a few months, showing scattered time columns instead of the first ones
- Fixed tooltips, hover labels and drag previews ignoring the dashboard theme, such as the KPI sparkline's hover label, the time series hover value, chart, table and map tooltips, and pivot and canvas drag previews
- Fixed explore and canvas dashboards failing to load on metrics views without time bounds, such as an empty table or one whose rows a security policy hides, and on data with placeholder dates such as
0001-01-01 - Fixed explore dashboards failing with
missing required dimensionwhen the metrics view has a measure that requires a dimension, such as a rolling window; leaderboards, totals, the dimension table and its exports now leave such measures out - Fixed explore dashboards, bookmarks and links failing with
not founderrors after a measure or dimension was removed from the metrics view while Rill Cloud kept serving the explore's last valid version - Fixed comparing by the time dimension in the time dimension detail view failing on ClickHouse with a duplicate alias error
- Fixed time series charts going blank when comparing values of a dimension whose name contains a dot, such as a Druid nested column
- Fixed pivots failing with a 500 error when sorted by a measure while a row dimension has a
uri - Fixed pivots and their exports failing when sorted by a field the pivot no longer shows, such as a removed measure or a comparison column with comparison off; they now use the default sort
- Fixed pivots crashing when a field was placed twice in rows or columns, and drag-reordering a pivot field leaving a second copy behind
- Fixed expanding a pivot row with no sub rows sending a failing query
- Fixed leaderboards, comparison series and filter chips failing to render when a dimension was listed twice, such as
?dims=publisher,publisher, or when comparing values such as0and null
Canvas
- A canvas with
comparison_mode: timenow opens with the firstcomparison_offsetsentry declared for its default range intime_ranges, such asrill-PMforrill-MTD - Fixed one table or pivot component with an invalid spec, such as one that references a removed measure, stopping the whole canvas from rendering for viewers
- Fixed pie, donut and funnel charts failing with
binary condition must have exactly 2 expressionswhen their dimension has no rows for the selected range or filters; they now render empty - Fixed donut and pie charts with an "Other" slice (
show_other: true) throwing an error on every data update - Fixed templated markdown components showing their raw template source while it resolves, or for good when the template renders nothing
Alerts and Reports
- Added a
where_resourcefilter toresource_statusalerts, so an alert can watch specific resources, such asmodel/ordersormetrics_view/*, instead of the whole project - Made alerts split by a dimension list up to 5 matching rows in their Slack and email notifications instead of only the first; change the limit, up to 50, with Rows in notifications in the alert dialog or
notify.rows_limitin YAML, and set it to 1 to keep one-row notifications - Fixed alert pages failing to open in Rill Cloud when the alert's criteria compare against the previous period, such as a percent change
- Fixed the links in alert and report emails failing to open dashboards whose metrics view has no time dimension
- Fixed weekly alerts and scheduled reports created in a language other than English being saved with an invalid schedule when the day was left at its default
Metrics Views
- Fixed comparison values going missing around daylight saving time changes for day and larger grains in time zones other than UTC, where each day's current and comparison values were split into separate rows
- Fixed sub-day grains in UTC failing on ClickHouse metrics views whose time dimension is a
DateorDate32column, which broke canvas KPI comparisons - Fixed rollups being used for one-sided time ranges they only partly cover, and a rollup that ends exactly at the base table's last row dropping that row
- Fixed Metrics SQL
now()filtering at the wrong time on DuckDB when the runtime does not run in UTC - Fixed an empty
INorNOT INfilter in Metrics SQL being read back as anIS NULLcheck
AI / LLM
- Made the AI analyst's charts keep the dashboard's filters when you chat from a dashboard, so a chart no longer shows unfiltered data next to filtered findings
- Made the AI analyst reply in the language of the question instead of opening its answers in English
- Made metrics view query errors say how to fix common mistakes, such as a measure passed as a dimension, comparison measures without
comparison_time_range, oreqwith a list of values instead ofin, so the AI analyst and MCP clients can correct their queries; also fixed invalid JSON in thequery_metrics_viewtool's examples - Fixed tool calls to the unified MCP server failing from recent ChatGPT clients
- Fixed Open in Rill links from AI answers failing when the query was sorted by a calculated measure or a field the dashboard doesn't show
- Fixed the conversation list failing to load when a conversation title was cut in the middle of a multi-byte character
- Fixed negative feedback from the downvote dialog being sent without the rated message, its categories or its comment
Rill Developer
- Fixed the model inspector sending failing row and column count queries for a model's connectors and for models that have not produced a table yet
Cloud
- Showed the compute price next to the seat price on the billing page's Starter and Growth plan cards, with a link to the full pricing breakdown
- Stopped the scheduled report dialog, the Status pages and the Share popover from requesting members, user groups and billing details the user can't read, which caused 403 errors; for those users, the Share popover lists only the project's members and the Status page hides the cluster size
- Made clicking the current page's name in the breadcrumbs, including the navigation bar in embeds, open its dropdown like the chevron next to it, instead of reloading the page
- Fixed dashboards failing with
Timed out waiting for a fresh JWTorjwt is expiredafter a laptop sleep, a network drop or a throttled tab until the page was reloaded; a request with an expired token now fetches a fresh one right away - Fixed a dashboard being replaced by an error page when a background refresh of the project failed, for example after waking a laptop; network errors now show the reconnect banner instead
- Fixed scheduled reports, bookmarks and PDF export failing to open in tabs left open across a Rill Cloud update; the tab now reloads once into the new version
Embedding
- Removed the Rill name from the AI memory dialog, so embedded dashboards don't show Rill branding there
Security
- Limited project variables (
.env) to templates in connectors and models; custom APIs, canvas component properties andifconditions, alerts, reports and templates sent through the API can no longer read them, and the parser reports an error where a project file references them (see Referencing Environment Variables) - Fixed private assets, such as project deploy archives, being downloadable without permission in organizations that have a public project
- Upgraded Go to 1.26.10 and dependencies with security advisories, including
go-jose(v4.1.9),golang.org/x/net,golang.org/x/crypto, the Postgres driver (pgxv5) and the Snowflake driver (gosnowflakev2)
Documentation
- Clarified how to connect Claude Code and the Claude desktop app to Rill Developer in the agentic quickstart
- Documented downloading canvas components as PNG, moving and duplicating tab groups, and setting per-viewer conditions in the visual editor