Rill 0.65 - Axis control and Dimension limits in Canvas
· 2 min read
note
⚡ Rill Developer is a tool that makes it effortless to transform your datasets with SQL and create fast, exploratory dashboards. Rill Cloud can then help enable shared collaboration at scale.
To try out Rill Developer, check out these instructions and join us over on Discord to meet the team behind the product as well as other users. In addition, once you have a project set up in Rill Developer, you can then deploy the project and collaborate with others / invite your team members by logging into Rill Cloud!
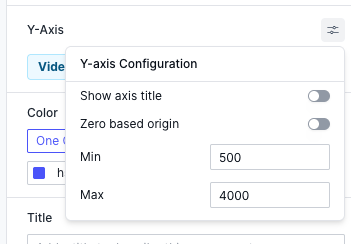
Axis control
You can now control the axis range for charts in Canvas. This is useful when you want to limit, for example, the maximum value to synchronize chart axes.
Dimension limits
When coloring a chart by dimension you now have access to limit and null controls!
Bug Fixes and Misc
- MCP:
- Added description to the
list_metrics_viewtool, - Added
ai_instructionstometricsView.yamlandrill.yaml.
- Added description to the
- Canvas:
- Added range selector for charts.
- Added limit to all canvas chart dimensions.
- Updated to DuckDB 1.3.
- Scrollable Resources in Status page.
- Fixed bug where Alerts not properly linked to Explore dashboards with spaces in name
- Fixed time grain reduction for Canvas referencing multiple metrics views.
- Fixed bug where you could accidentally change your own role in project share UI.
- Fixed issue that project page would not load for specific users due to query error.
- Fixed inconsistent .git suffix in Git remotes.