Build Canvas Dashboards
While Rill's signature Explore dashboards let you slice, dice, and interact with your data in our suggested layout, Canvas dashboards let you define your own visualizations and arrange them into your preferred layout.
Canvas dashboards are built using various components that can display data, create visualizations, and add rich content from independent metrics views. You can create components dynamically through the visual Canvas Dashboard interface or define them in individual YAML files.
Available Components
Canvas dashboards support five main types of components:
- Data components - Display structured data and key metrics (KPIs, leaderboards, tables)
- Chart components - Create rich visualizations (bar charts, line charts, heat maps, etc.)
- Map components - Plot measures by location as points or shaded regions
- Custom viz components - Reusable charts with params, built from 32 chart types or a Vega-Lite spec
- Miscellaneous components - Add text, images, and other content
Each component page shows both the visual result and the corresponding YAML code, making it easy to understand how to implement them in your own dashboards.
For a complete overview of all available components, see our Canvas components reference.
Creating a Canvas Dashboard
A Visual Editing Experience
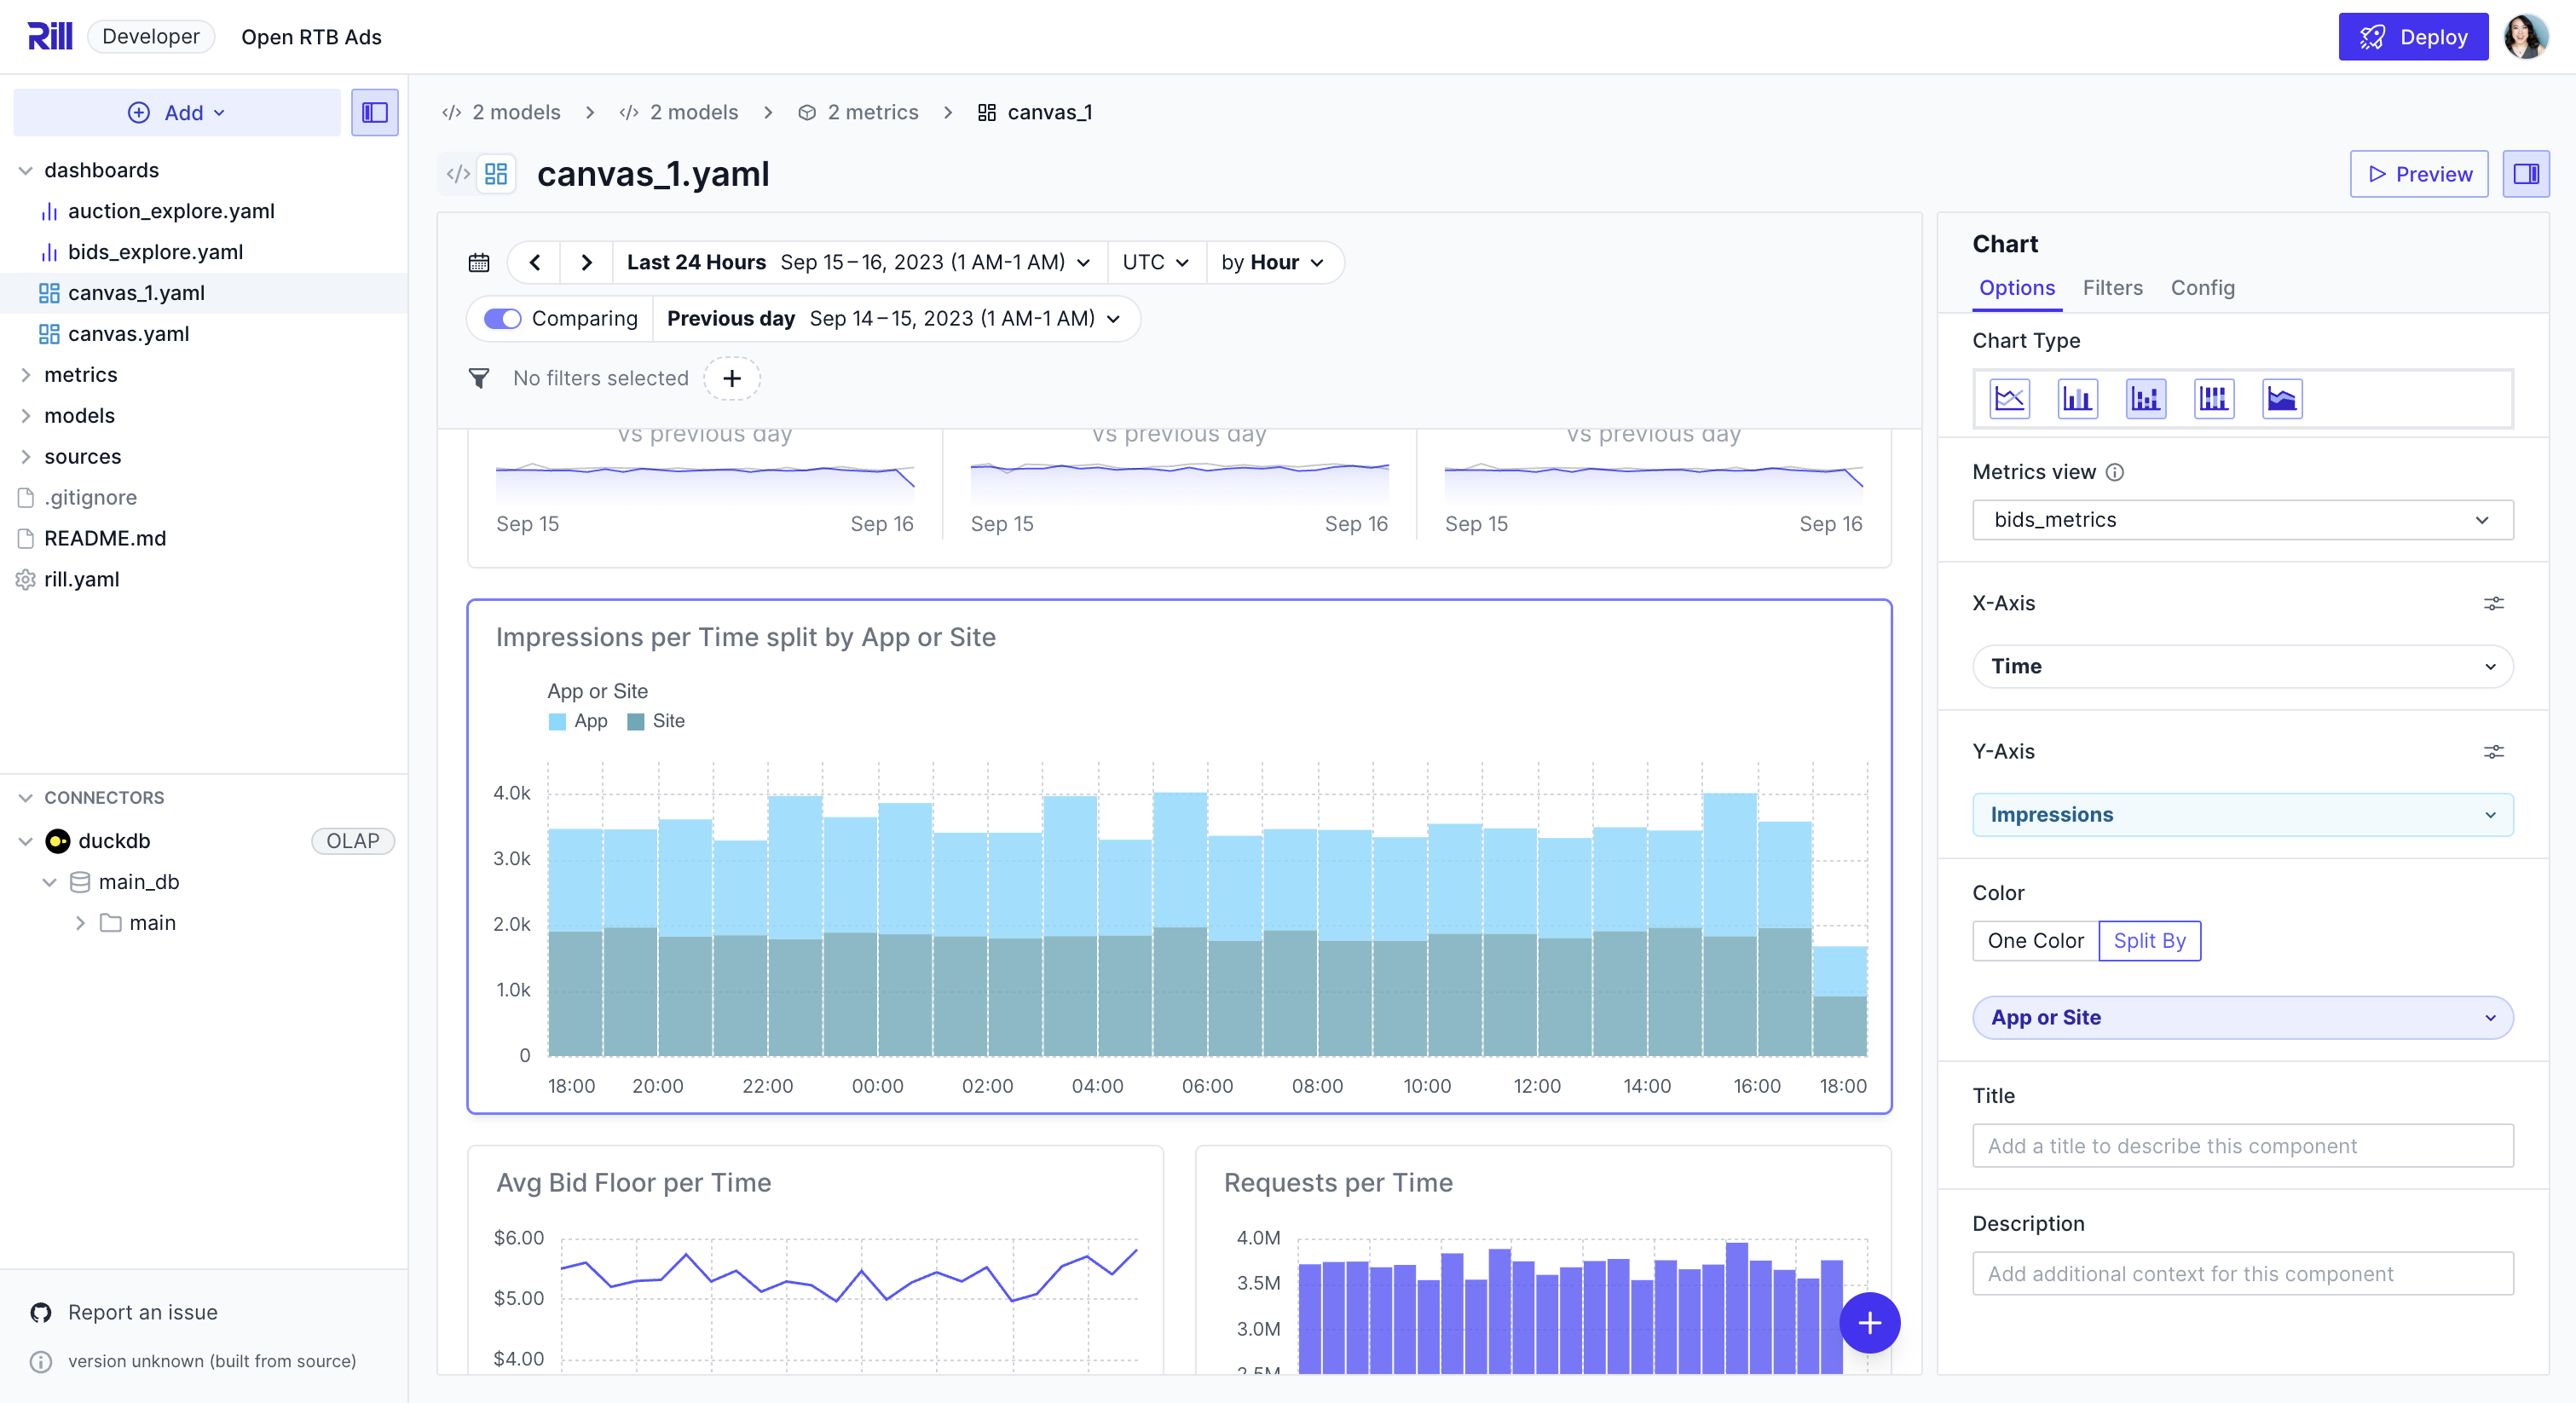
To modify any single widget, click to select it and use the right-hand panel to change its associated properties. Click outside the widget to view global properties associated with the overall Canvas.
Filters
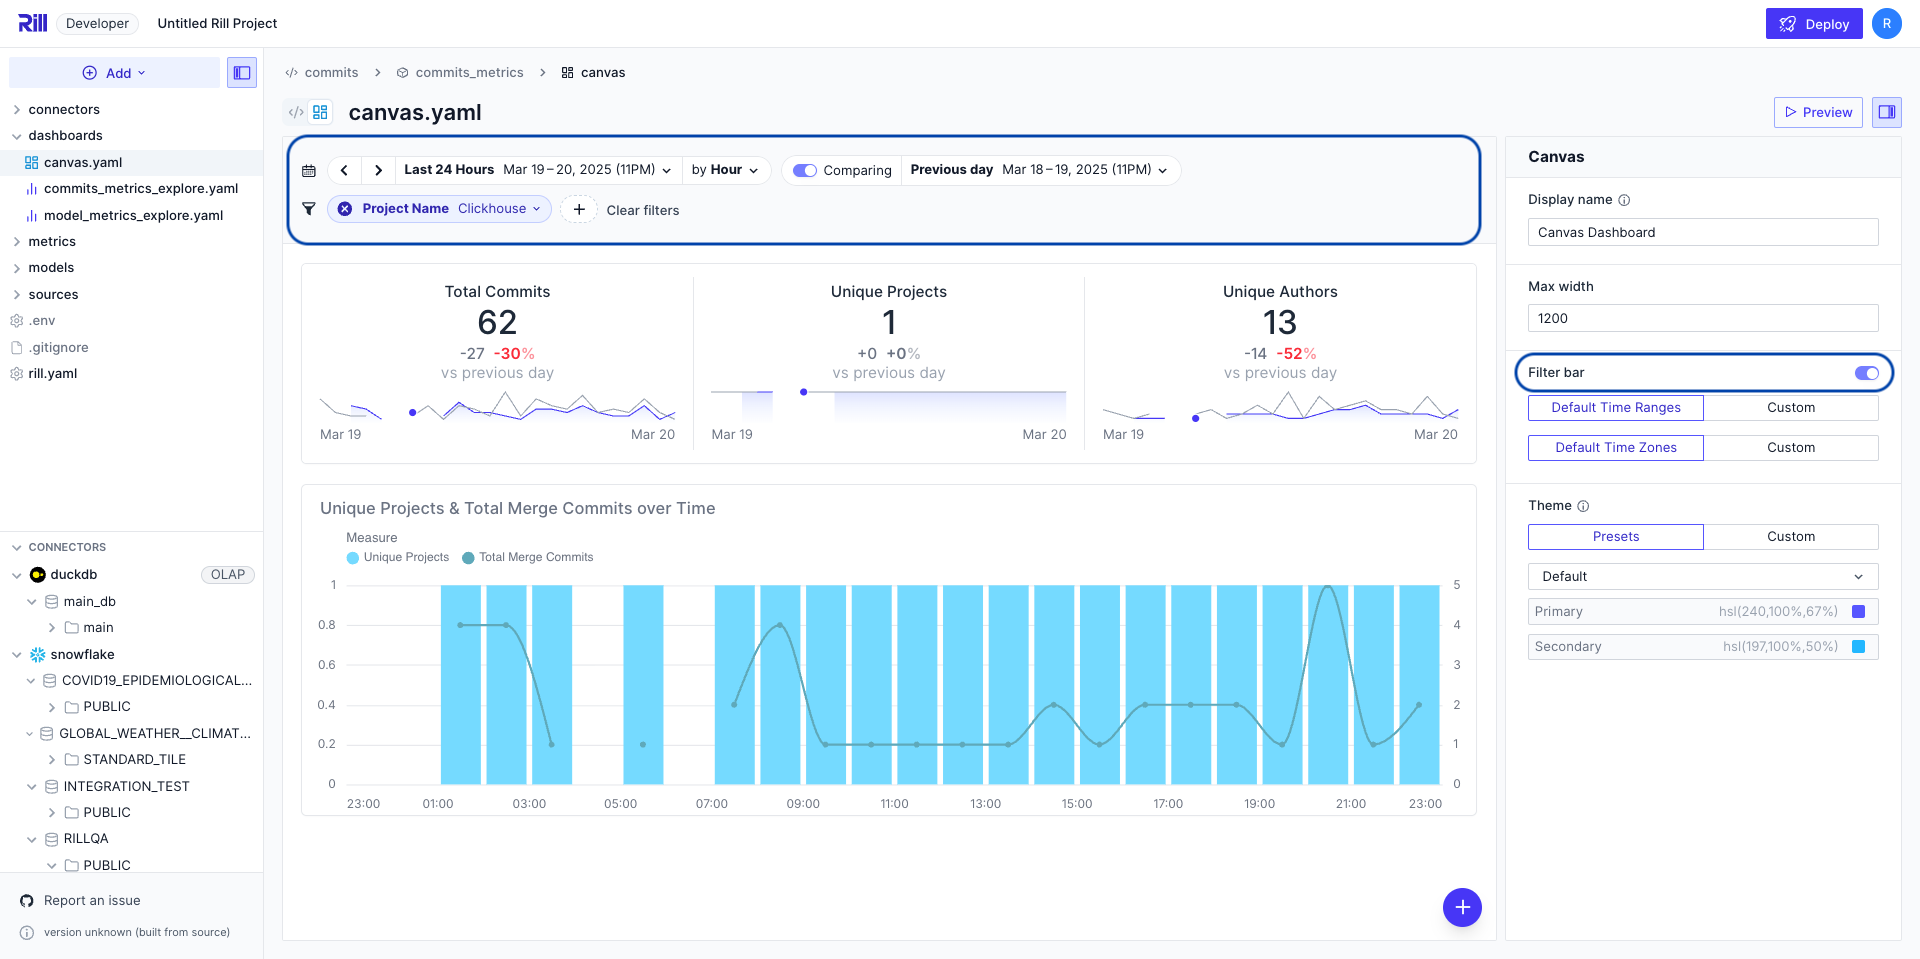
Optionally toggle on the global filter bar under Canvas properties to give dashboard viewers access to the same time and dimension filters available on Explore dashboards.
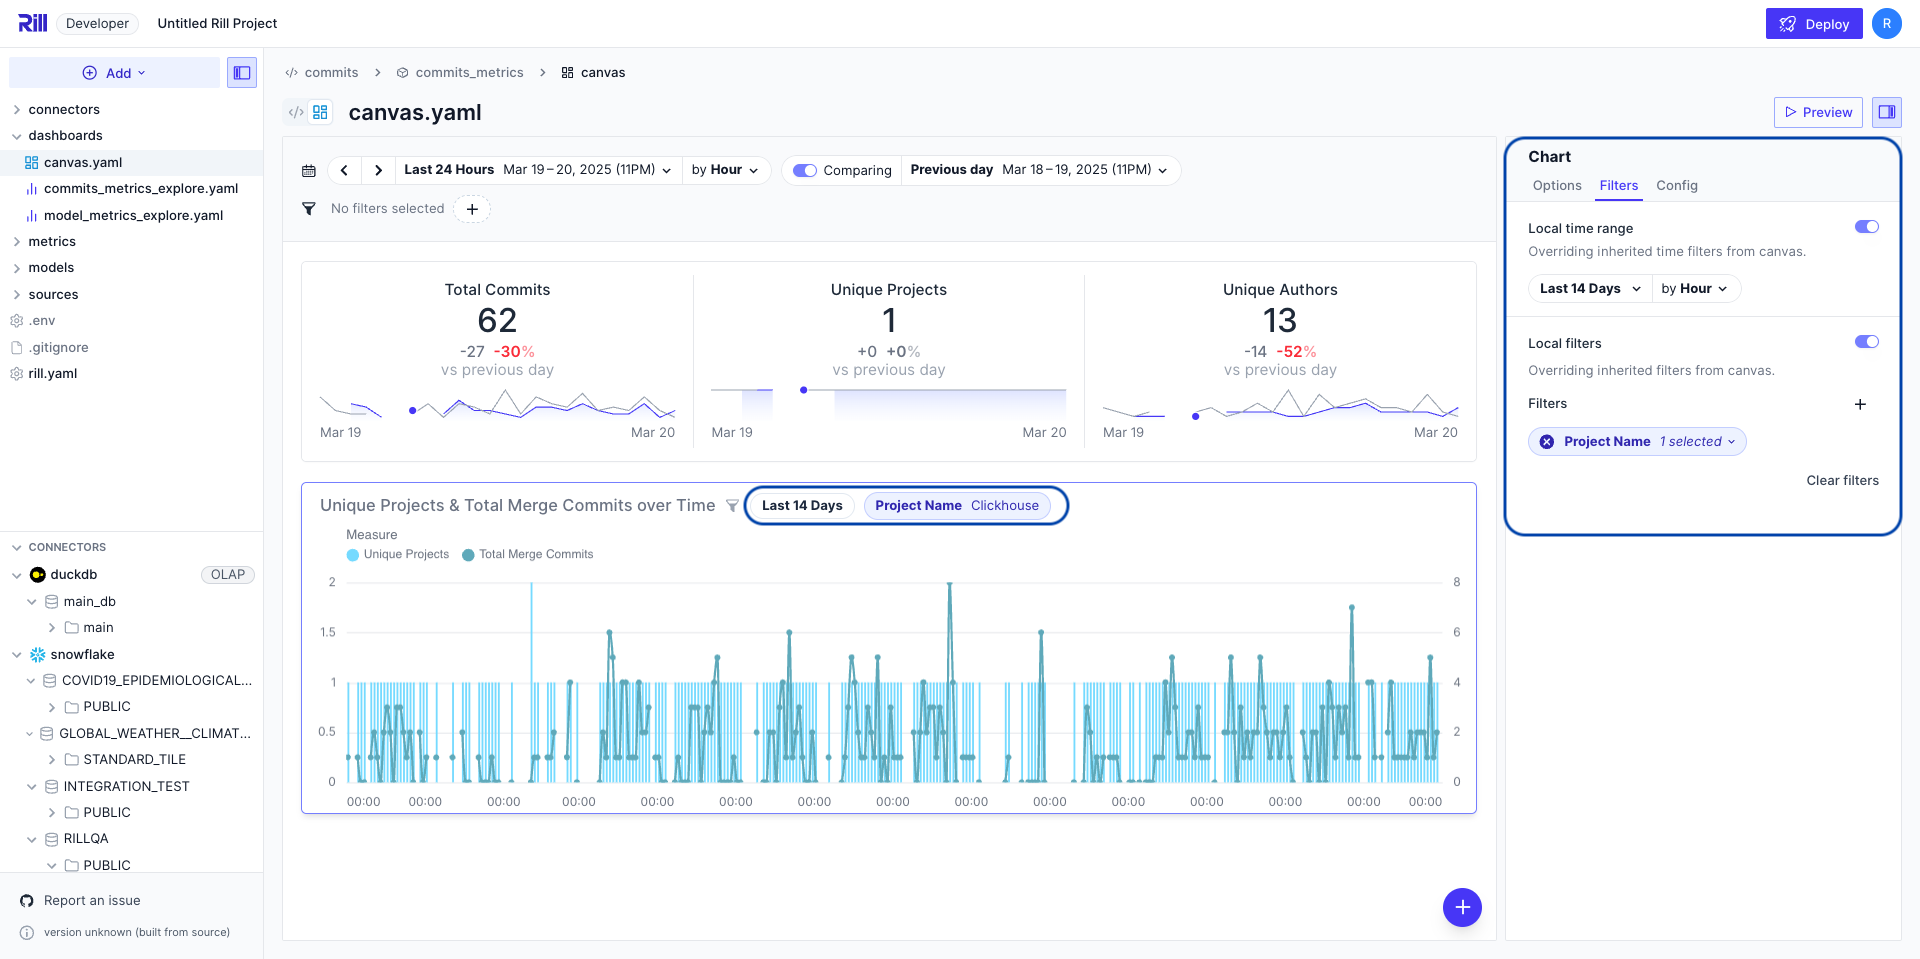
Local filters for a single KPI, Chart, or Table can be separated from the global filters via the "Filters" tab in the properties panel, where you can set filters that are local to just that widget.
Local filters are shown as chips in the widget's header. To keep the filter but hide the chips from viewers, turn off Show filters on component in the same "Filters" tab (or set hide_local_filters: true in YAML).
To keep a filter in the global filter bar at all times, or to block the canvas until viewers select a value for it, use filters.pinned and filters.required. See Pin and require filters.
Making changes to the YAML
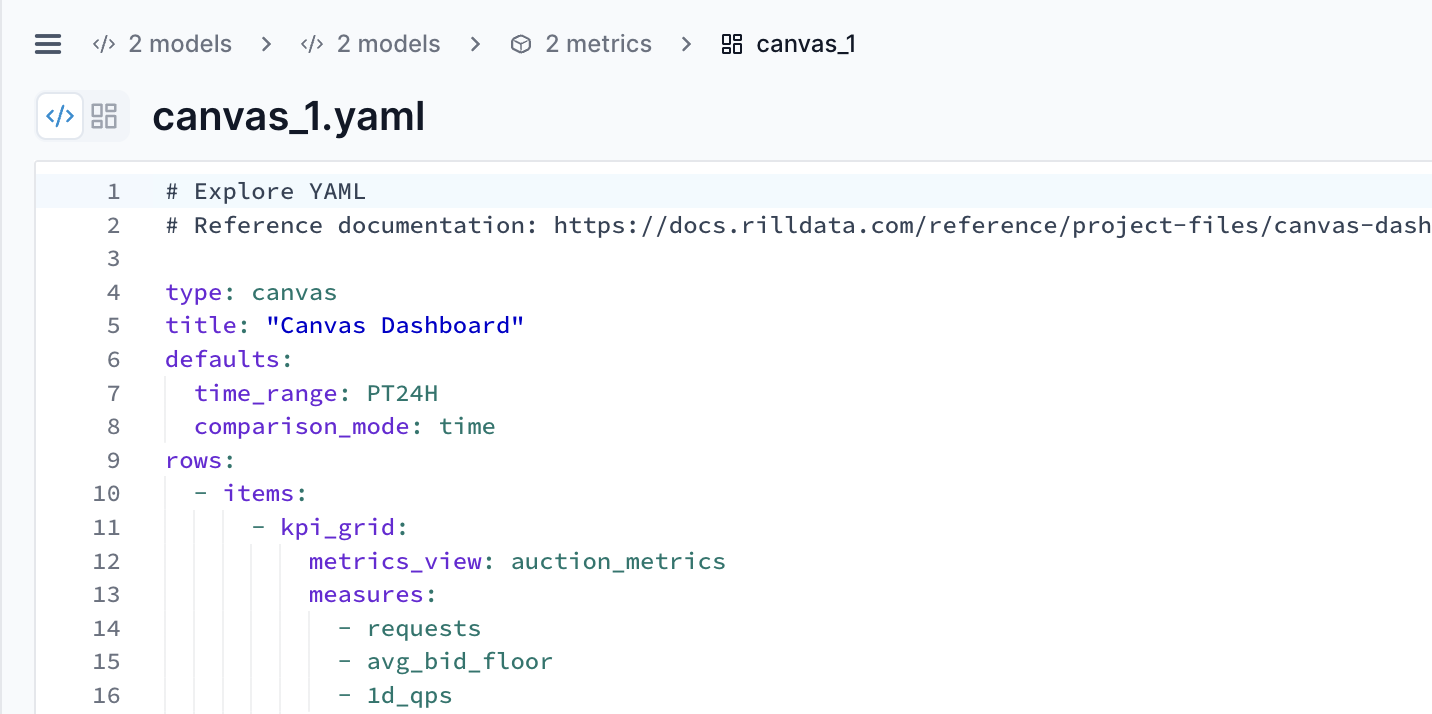
While we encourage creating Canvas dashboards via the visual editing experience described above, you can always edit the YAML file directly using the code view by toggling the switch next to the filename at the top of the page. Please see our customization page and reference documentation for more information.
Set project-wide default time ranges and available options for all canvas dashboards. Learn more about canvas defaults →
Default Filters
Dashboard creators can configure default filters to establish a consistent starting point for viewers. Filters are defined as Metrics SQL WHERE expressions, keyed by the metrics view name they apply to.
defaults:
  filters:
    # Key is the metrics view name; value is a Metrics SQL WHERE expression
    my_metrics_view: "country IN ('US', 'CA') AND revenue > 1000"
    another_metrics_view: "status = 'active'"
This lets you pre-filter data across one or more metrics views used in the canvas, ensuring users begin their analysis with the most relevant context.
For detailed YAML configurations, see the defaults section in our reference documentation.
Show Content to Some Viewers Only
Add an if condition to a row, tab group, tab or component to show it only to some viewers. One canvas can then serve several audiences, such as finance and sales teams, or the basic and premium tiers of an embedded dashboard.
rows:
  # Everyone sees the KPIs
  - items:
      - kpi_grid:
          metrics_view: orders
          measures: [total_revenue, order_count]

  # Only members of the finance group see this row
  - if: '{{ has "finance" .user.groups }}'
    items:
      - width: 8
        line_chart:
          metrics_view: orders
          x: { field: order_date, type: temporal }
          y: { field: gross_margin, type: quantitative }
      # Only admins in the finance group see this table
      - width: 4
        if: '{{ .user.admin }}'
        table:
          metrics_view: costs
          columns: [cost_center, total_cost]

  - name: deep_dives
    tabs:
      - label: Pipeline
        if: '{{ has "sales" .user.groups }}'
        rows: # ...
      - label: Cohorts
        # `plan` is a custom attribute, e.g. passed by an embedding app
        if: '{{ eq .user.plan "premium" }}'
        rows: # ...
Conditions use the same templating and user attributes as security policies. A few things to know:
- An element shows only when its own condition and the conditions of the rows, tabs and groups containing it are all true.
- Built-in attributes (
name,email,domain,groups,adminandembed) always resolve, even for an embedded dashboard that only passes custom attributes. A condition that references a custom attribute the viewer doesn't have is false. To treat a missing attribute as a value instead, useget, as in'{{ ne (get .user "plan") "premium" }}'. - When components are hidden, the rest of the row widens to fill it, and rows and tabs left empty disappear.
- Hidden content is removed before the dashboard reaches the viewer, including its components and the conditions themselves. In an embedded dashboard or a public URL that's restricted to the canvas, the viewer also can't query the metrics views that only hidden content uses.
- Hiding content doesn't restrict data elsewhere: a viewer with access to a metrics view can still query it, for example in an Explore dashboard. To restrict data, add a security policy to the metrics view.
- Public URLs and scheduled reports that run as their creator show what the creator can see.
To check what each audience sees, add mock users with their attributes to rill.yaml and use View as in the dashboard preview. In the visual editor, components that are only shown to some viewers have an indicator, and you can set a component's condition in its Visible when field.
Example Canvas Dashboards
Here are a few deployed examples of Canvas dashboards that you can check out!