Rill 0.61 - Pie, Donut, and Heatmap Charts and remembering where you last were! 👀
⚡ Rill Developer is a tool that makes it effortless to transform your datasets with SQL and create fast, exploratory dashboards. Rill Cloud can then help enable shared collaboration at scale.
To try out Rill Developer, check out these instructions and join us over on Discord to meet the team behind the product as well as other users. In addition, once you have a project set up in Rill Developer, you can then deploy the project and collaborate with others / invite your team members by logging into Rill Cloud!

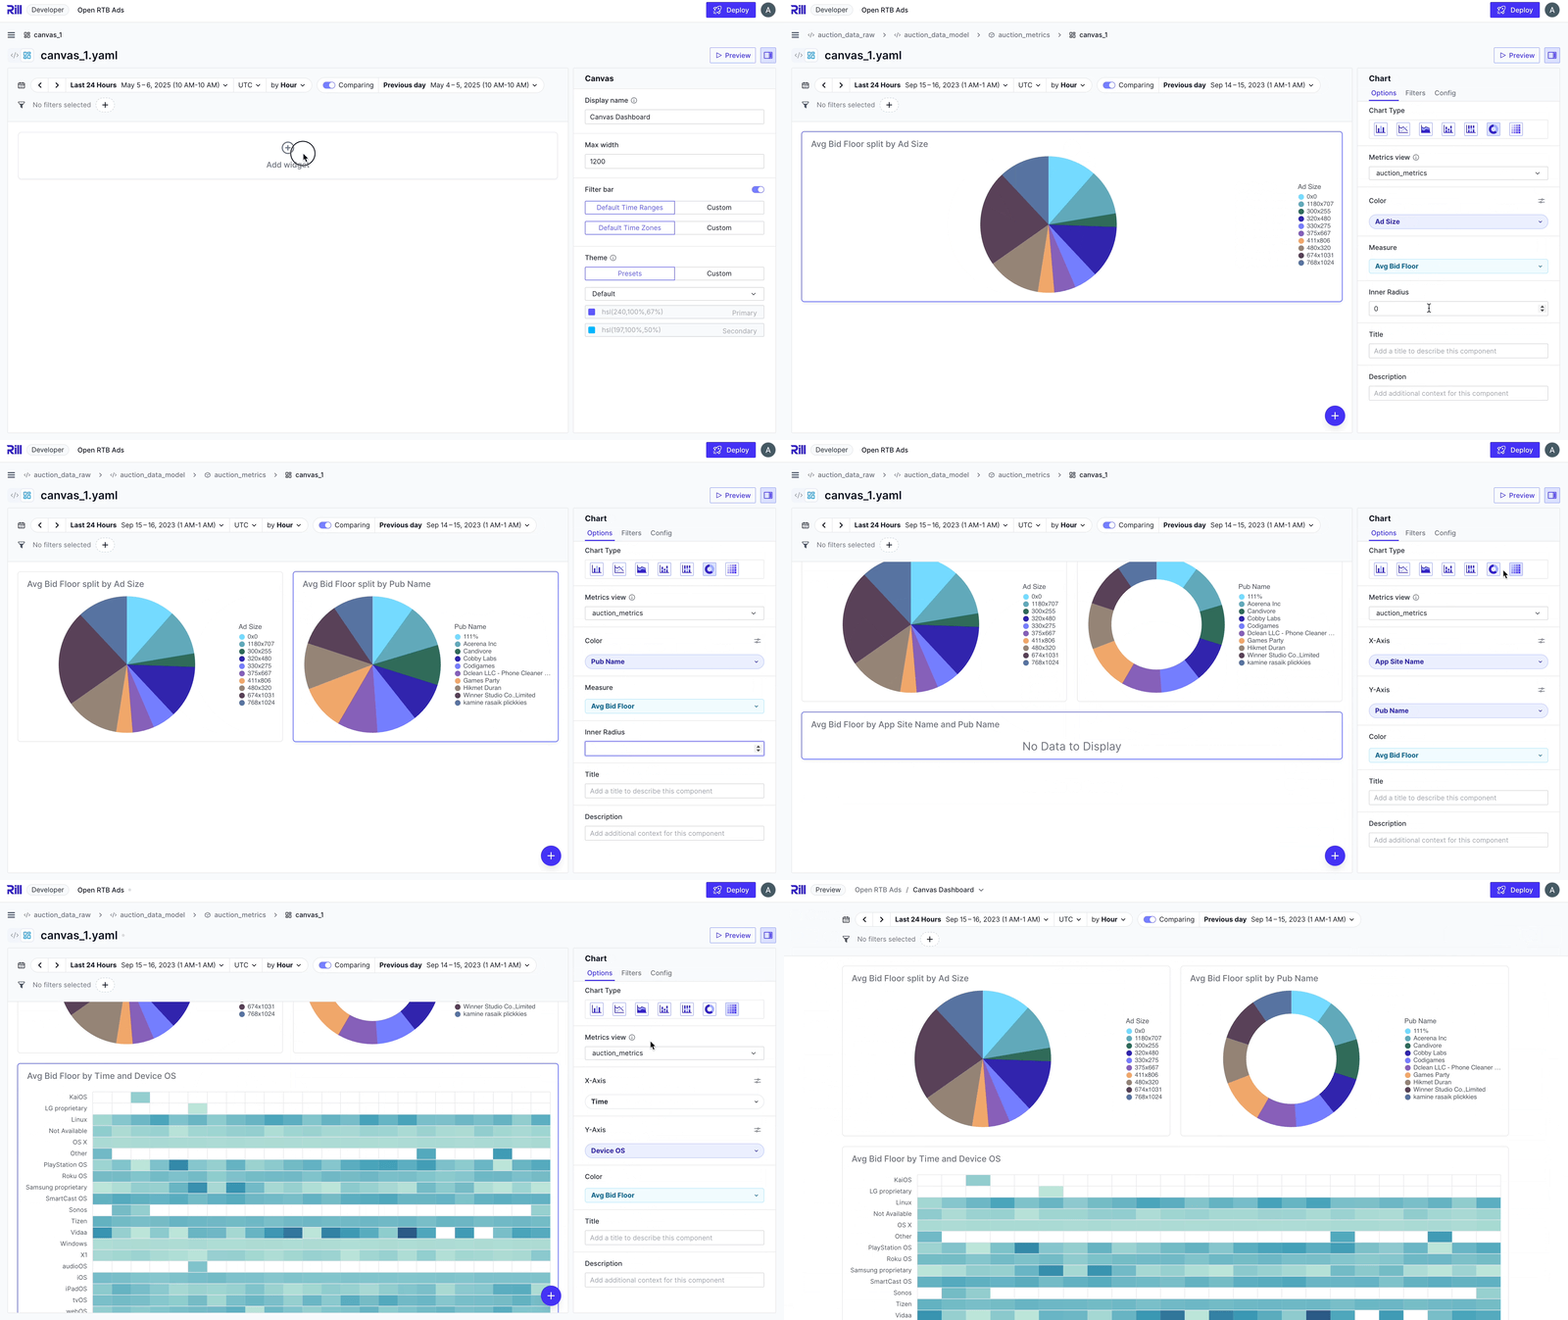
✨ Pie, Donut, and Heatmap Charts for Canvas Dashboards
We're expanding your visualization toolkit in Canvas Dashboards with three powerful new chart types:
🥧 Pie Charts
Great for showing part-to-whole relationships at a glance. Ideal when you have a small number of categories and want to emphasize proportionality — like sales by region or traffic source breakdowns.
🍩 Donut Charts
Similar to pie charts, but with a center cutout that improves readability and makes room for central labels or KPIs. Best used when you want a cleaner look or to display a key metric in the middle.
🔥 Heatmaps
Perfect for spotting patterns, concentrations, or anomalies across two dimensions — such as time vs. activity, product vs. region, or weekday vs. hour. Use heatmaps when you're working with dense data and want a quick overview of distribution.
These additions help you tell richer stories with your data and offer more flexibility when designing Canvas dashboards for your team or stakeholders.
🔥 Breaking Change: Dashboards Now Prioritize Your Last State
We’ve updated how deployed Rill dashboards load in Rill Cloud. Dashboards will now prioritize restoring the state you last used, while still respecting developer-defined configurations.
When opening a dashboard:
- Your most recent state is restored first - ensuring your metrics and dimension order, visibility and time settings are applied.
- Any missing settings are filled in from the “Home” bookmark, if one has been configured.
- If needed, remaining gaps fall back to YAML defaults defined by the developer.
This new behavior ensures your personal preferences come first, while still honoring any team-level or default settings.
Bug Fixes and Misc
- Canvas Dashboard
- Attempt to serve Canvas dashboard even when underlying metrics have errors.
- Preserve leaderboard dimension order.
- Added leaderboard icon.
- Validates all metrics views use the same
first_day_of_weekandfirst_month_of_year. - Fixed bugs when moving components in Canvas Editor.
- Set max limit to 4 components per row.
- Upgrade to DuckDB 1.2
- Increase alert/report spec size limit to 128kb
- New look to User Management page in preparation for things to come!
- Added export with sort by time in flat mode table.
- Re-validate metrics view on external tables on
rill project refresh. - Fixed bug where searching for an email in View As would exit the text box.
- Fixed bug on time range export, IE: Month to Date returning a blank file.
- Fixed big number on Explore that does not have a timestamp column, re-renders on a re-fetch.
- Fixed issue where some first-time deployments did not see the Deploy Project UI.
- Fixed issue with Pinot connector, frontend not reflecting changes made to backend. Now connectivity works.
- Fixed issue where checkmarks for selected dimensions not shown in TDD in Explore dashboard.
- Fixed GitHub repository sync issue where repository is already up to date.
- Fixed issue where Explore dashboard would show error on first reconcile due to model still being loaded.
- Fixed issue where measure filter converting to advanced filter.
- Fixed dimension bulk search when both newline and comma present.