Miscellaneous Widgets
Miscellaneous widgets in Rill Canvas provide additional functionality for text, images, and other non-data elements. These widgets help enhance your dashboards with rich content. For more information, refer to our Components reference doc.
Text/Markdown
Text widgets allow you to add formatted text, markdown content, and documentation directly to your dashboards. You can also use metrics_sql and metrics_sql_rows to display data from Metrics SQL queries.
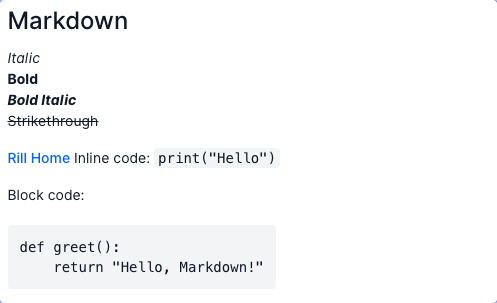
- markdown:alignment:horizontal: leftvertical: middlecontent: |-# Markdown*Italic***Bold*****Bold Italic***~~Strikethrough~~[Rill Home](https://rilldata.com)Inline code: `print("Hello")`Block code:```pythondef greet():return "Hello, Markdown!"width: 6
Dynamic Markdown
The metrics_sql template function allows you to execute a Metrics SQL query and display the results as formatted text in your dashboard. This is useful for displaying aggregated data or custom metrics.
The metrics_sql_rows template function allows you to execute a Metrics SQL query and iterate over the results, displaying each row with custom formatting. This is useful for displaying multiple data points in a structured format.
Use metrics_sql_rows to get query results and then iterate over them using Go template syntax. You can access columns using dot notation (.column_name) or by assigning a variable name in the range:
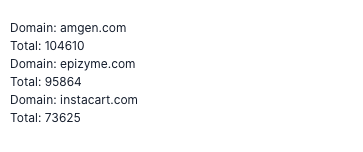
- markdown:content: |-{{ $rows := metrics_sql_rows "SELECT total_bids, adomain FROM bids_metrics ORDER BY total_bids DESC LIMIT 3" }}{{ range $index, $row := $rows }}<div style="font-weight: 600;">{{ $row.publisher }}</div><div>Domain: {{ $row.adomain }}</div><div>Total: {{ $row.total_bids }}</div>{{ end }}width: 6
Alternatively, you can use dot notation directly without assigning a variable:
- markdown:
    content: |-
      {{ $rows := metrics_sql_rows "SELECT publisher, total_records FROM ad_bids_metrics LIMIT 5" }}
      {{ range $rows }}
      <div>{{ .publisher }}: {{ .total_records }}</div>
      {{ end }}
The metrics_sql_rows function returns an array of rows that you can iterate over with {{ range }}. Access columns using either {{ $row.column_name }} (when using named variables) or {{ .column_name }} (when using dot notation).
For more information on Metrics SQL syntax and capabilities, see the Metrics SQL API documentation.
Image
Image widgets let you embed images, logos, and visual elements into your dashboards. Put files in your public/ folder and reference them directly in the url as public/image.png.

- image:url: https://cdn.prod.website-files.com/659ddac460dbacbdc813b204/660b0f85094eb576187342cf_rill_logo_sq_gradient.svgwidth: 6
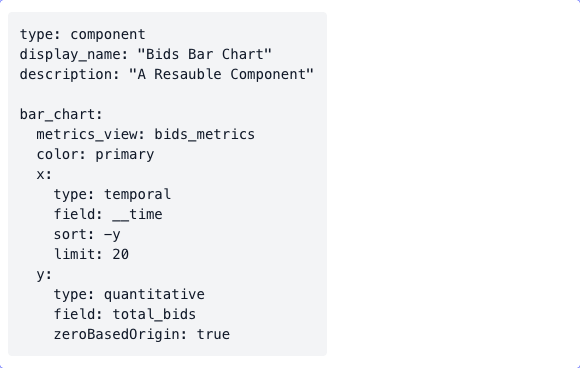
Component
Reference a reusable component created outside of the canvas dashboard.
- component: my_component