Map Widget
The map widget plots a metrics view on an interactive basemap. Use it to show how a measure is distributed geographically: stores, sensors, or customers as points, or states, countries, or sales territories as shaded regions. For more information, refer to our Components reference doc.
Each map needs a geo dimension that holds a location for every row, and a color measure. Points can also be sized by a second measure.
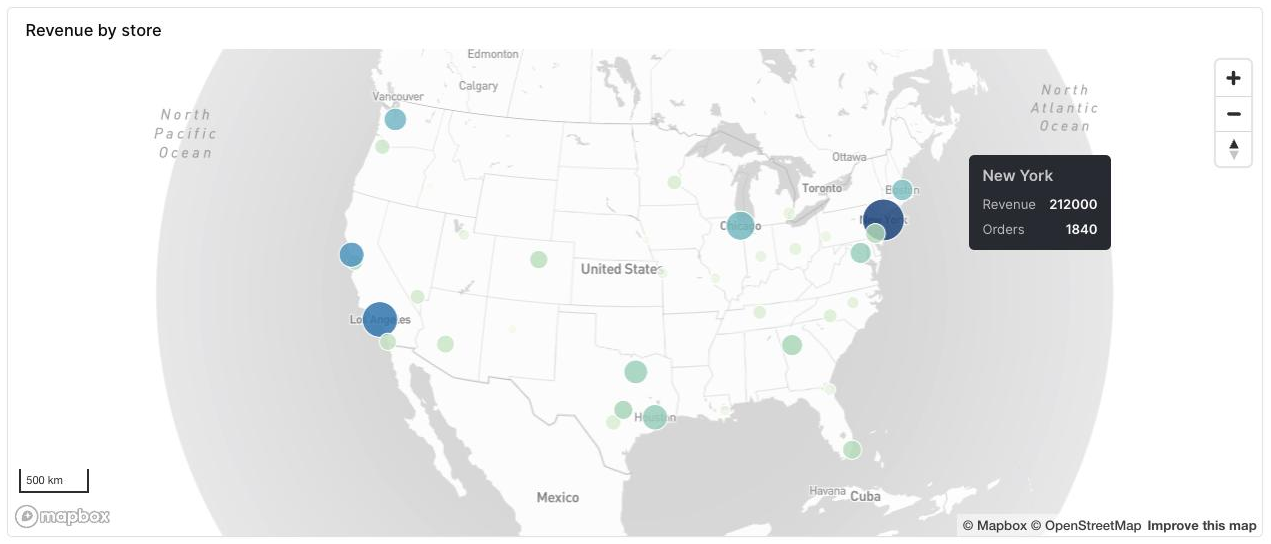
- map:metrics_view: store_sales_metricstitle: Revenue by storegeo_dimension:field: locationtype: nominalcolor:measure: total_revenuecolorRange:mode: schemescheme: tealbluessize_measure:field: total_orderstype: quantitativetooltip_dimension:field: citytype: nominal
Prepare geographic data
The geo dimension must contain one of the following values in every row. Coordinates are always longitude first, then latitude, in degrees (WGS84).
| Format | Example | Draws |
|---|---|---|
| GeoJSON geometry string | {"type":"Point","coordinates":[-122.42,37.77]} | Point, MultiPoint, Polygon, and MultiPolygon geometries |
GeoJSON Feature string | {"type":"Feature","geometry":{...},"properties":{}} | The feature's geometry. Its properties are ignored. |
DuckDB POINT_2D column | ST_Point2D(-122.42, 37.77) | A point |
DuckDB POLYGON_2D column | A polygon made of [longitude, latitude] rings | A polygon |
Rows with an empty value, a string that isn't valid GeoJSON, or a line geometry aren't drawn.
Rill loads the DuckDB spatial extension by default, so functions such as ST_Point, ST_AsGeoJSON, and ST_Read work in any DuckDB model without extra setup.
Points from latitude and longitude columns
Convert latitude and longitude columns to a GeoJSON string in your model. Note that ST_Point takes longitude first. Cast the result to VARCHAR so it is stored as a string.
-- models/store_sales.sql
SELECT
  city,
  state,
  ST_AsGeoJSON(ST_Point(longitude, latitude))::VARCHAR AS location,
  orders,
  revenue
FROM stores
Alternatively, ST_Point2D(longitude, latitude) AS location stores a DuckDB POINT_2D value, which Rill detects as a geo dimension automatically.
Regions from a GeoJSON file
To shade regions, load their boundaries as polygons. The following model reads a GeoJSON FeatureCollection file from your project's data folder and returns one row per feature, with the feature's geometry as a GeoJSON string:
-- models/state_population.sql
SELECT
  feature.properties.name AS state,
  to_json(feature.geometry)::VARCHAR AS boundary,
  feature.properties.density AS population_density
FROM (
  SELECT unnest(features) AS feature
  FROM read_json('data/us-states.geojson')
)
Relative paths in read_json resolve from your project root. For other spatial formats, such as shapefiles, ST_Read returns each shape in a geom column that you can convert with ST_AsGeoJSON(geom)::VARCHAR.
To color regions by data from another model, join your facts to the boundaries on a shared key, such as a state or country code.
Mark the dimension as a geo dimension
In the metrics view, set type: geo on the dimension that holds the location. The visual editor only offers geo dimensions in the map's Geo dimension selector. Columns of type DuckDB POINT_2D or POLYGON_2D, or ClickHouse Point or Polygon, are detected as geo dimensions without setting the type.
# metrics/store_sales_metrics.yaml
type: metrics_view
model: store_sales
dimensions:
  - name: location
    display_name: Location
    column: location
    type: geo
  - name: city
    display_name: City
    column: city
measures:
  - name: total_revenue
    display_name: Revenue
    expression: SUM(revenue)
    format_preset: currency_usd
  - name: total_orders
    display_name: Orders
    expression: SUM(orders)
See Metrics view YAML for all dimension properties.
Add a map to a canvas
- In your canvas dashboard, click Add widget and select Map.
- Choose a Metrics view. The map selects the first geo dimension and the first measure of the metrics view.
- Under Geo dimension, pick the dimension that holds the locations.
- Under Color, pick the measure and a color scheme or gradient.
- Optionally, add a Size measure and a Tooltip dimension.
The map draws as soon as it has a metrics view, a geo dimension, and a color measure. You can also define the widget directly in the canvas YAML, as in the examples on this page.
Point maps
When the geo dimension holds points, each row is drawn as a circle. The color measure sets its color, and the optional size_measure scales its radius from 4 to 20 pixels between the smallest and largest value. Without a size measure, every point has the same size.
Use a point map for locations such as stores, venues, or devices. Nearby points can overlap at low zoom levels; zoom in to separate them.
Region (choropleth) maps
When the geo dimension holds polygons, each region is filled with the color of its measure value and outlined in the theme's primary color. The map switches to region mode automatically based on the data, and hides the Size measure setting, which only applies to points.
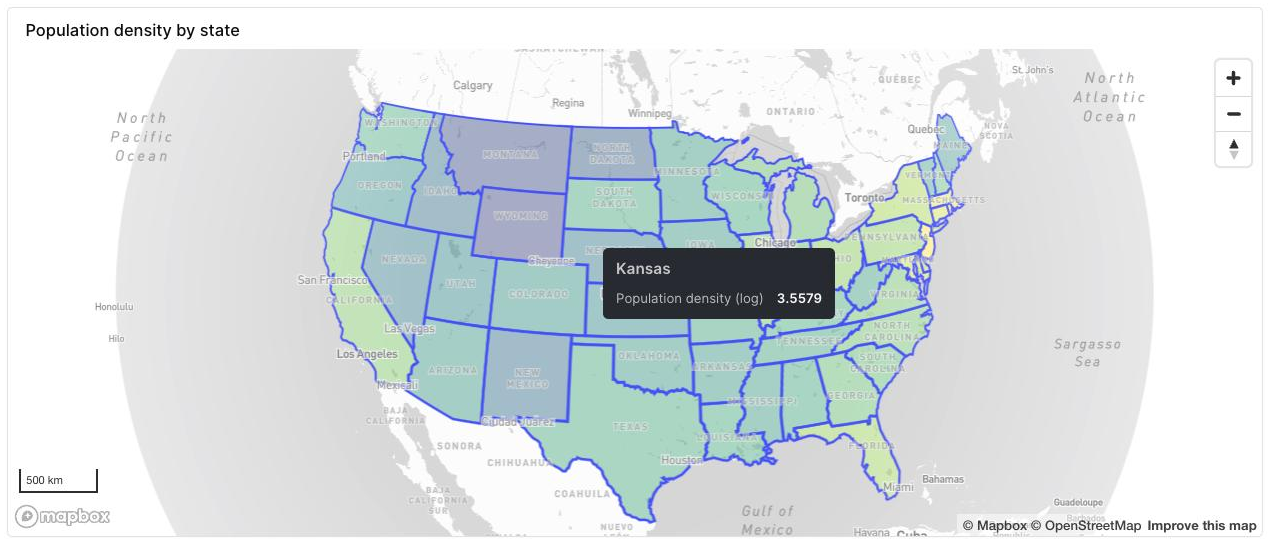
- map:metrics_view: state_population_metricstitle: Population density by stategeo_dimension:field: boundarytype: nominalcolor:measure: log_population_densitycolorRange:mode: schemescheme: viridistooltip_dimension:field: statetype: nominalinitial_view:longitude: -98.5latitude: 39.5zoom: 3
Colors are spread linearly between the lowest and highest value on the map. If a few regions have much larger values than the rest, most regions end up in the same color. In the example above, the measure is LN(AVG(population_density)) for that reason; a log-scaled or ratio measure (such as a per-capita value) often spreads colors more evenly.
Properties
| Property | Required | Description |
|---|---|---|
metrics_view | Yes | Metrics view to query. |
geo_dimension.field | Yes | Dimension that holds each row's location. See Prepare geographic data. |
color.measure | Yes | Measure that sets the color of each point or region. |
color.colorRange | No | Color scale. Defaults to the tealblues scheme. See Colors. |
size_measure.field | No | Measure that scales the radius of each point. Points only. |
tooltip_dimension.field | No | Dimension shown as the heading of the hover tooltip, such as a city or state name. |
initial_view | No | longitude, latitude, and optional zoom the map opens with. See Set the initial view. |
title, description | No | Title and description shown in the widget header. |
time_filters, dimension_filters | No | Filters that apply to this widget only, as on other canvas widgets. |
The type values under geo_dimension, size_measure, and tooltip_dimension (nominal or quantitative) are written by the visual editor. You can include them as shown in the examples.
Colors
colorRange takes one of two forms:
# A named color scheme
color:
  measure: total_revenue
  colorRange:
    mode: scheme
    scheme: viridis

# A gradient between two colors
color:
  measure: total_revenue
  colorRange:
    mode: gradient
    start: "#dbeafe"
    end: primary
Available schemes are tealblues, viridis, magma, inferno, plasma, cividis, blues, teals, greens, greys, oranges, purples, reds, turbo, and spectral, plus sequential and diverging, which use the palettes of your dashboard theme. Gradient start and end accept a hex color, or primary and secondary for the theme colors.
Set the initial view
By default, the map zooms to fit all of its data the first time it loads. To open the map on a fixed area instead, set initial_view:
initial_view:
  longitude: -98.5
  latitude: 39.5
  zoom: 3
zoom ranges from 0, which shows the whole world, to about 22, which shows individual buildings. When initial_view is set, the map never zooms to fit the data.
Interacting with a map
- Pan and zoom: Drag to pan, scroll or pinch to zoom, and use the zoom and compass buttons in the top-right corner. A scale bar is shown in the bottom-left corner.
- Tooltips: Hover over a point or region to see its tooltip dimension value, the color measure, and the size measure.
- Filters: The map follows the canvas time range and filters. Changing a filter updates the data without moving the map, so the area you zoomed into stays in view.
- Dark mode: The basemap switches between a light and a dark style with the dashboard's theme mode.
Limitations
- Coordinates must be longitude and latitude in degrees. Projected coordinates, such as meters in a local coordinate system, aren't supported. Reproject them in your model first, for example with DuckDB's
ST_Transform. - Line geometries (
LineString,MultiLineString) aren't drawn. - The map loads up to 5,000 rows, one for each combination of geo dimension and tooltip dimension values. Choose a tooltip dimension that has one value per location, and aggregate very large point sets, for example to a grid or to regions, before mapping them.
- The basemap is loaded from Mapbox in the viewer's browser, so viewers need access to
api.mapbox.com.
Rill includes a Mapbox access token for the basemap. If you build the Rill frontend yourself and want to use your own Mapbox account, set RILL_UI_PUBLIC_MAPBOX_ACCESS_TOKEN to a public (pk.) Mapbox token when you build it. The value is embedded in the frontend bundle at build time, so setting it on a running server has no effect.