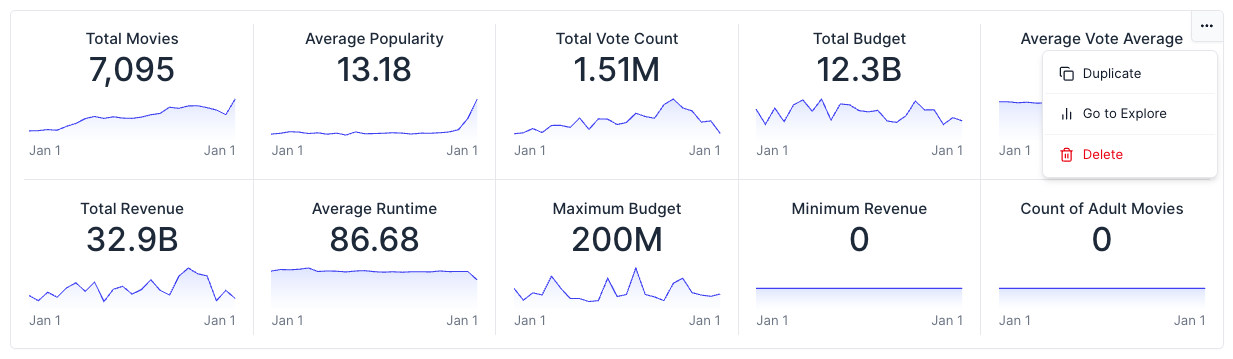
Data Widgets
Data widgets in Rill Canvas allow you to display raw data in various formats. These widgets are perfect for showing detailed information, metrics, and tabular data. For more information, refer to our Components reference doc.
KPI Grid
KPI grids display key performance indicators in a compact grid format with comparison capabilities. You can select up to 10 concurrent measures to display in a single widget
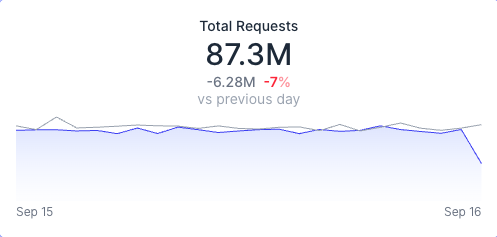
- kpi_grid:comparison:- delta- percent_changemetrics_view: auction_metricsmeasures:- requests
Widgets follow the canvas time range and time comparison by default. Override either one with time_filters, which takes the same tr and compare_tr parameters as an explore URL. tr=inherit keeps the canvas time range, and once tr is set a missing compare_tr turns delta and comparison off for that widget only. compare_tr=inherit follows the canvas comparison, and a comparison range such as rill-PW (previous week) or rill-PY (previous year) compares the widget against its own previous period. This works on KPI grids, tables, pivots, leaderboards, and time-series charts.
- kpi_grid:
    metrics_view: auction_metrics
    measures:
      - requests
    # Canvas time range, comparison off
    time_filters: tr=inherit
Leaderboard
Leaderboards show ranked data with the top performers highlighted.
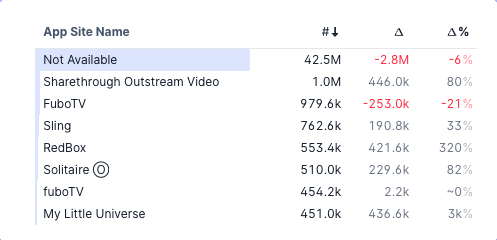
- leaderboard:measures:- requestsmetrics_view: auction_metricsnum_rows: 7dimensions:- app_site_name
Pivot/Table
Tables display detailed data in a structured format with customizable columns.
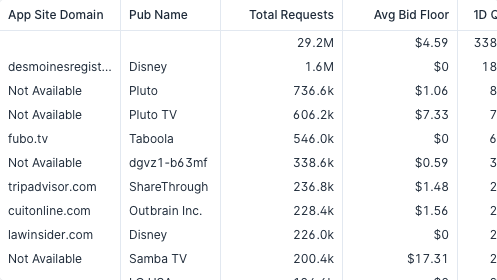
- table:columns:- app_site_domain- pub_name- requests- avg_bid_floor- 1d_qpsmetrics_view: auction_metrics
Column widths, styling, and sort
Every entry of a table's columns (and of a pivot's measures, row_dimensions, and col_dimensions) is either a field name or an object with the name plus presentation overrides for that column. Component-level properties control fitting, wrapping, and the initial sort.
- table:
    metrics_view: auction_metrics
    fit_to_width: true
    wrap_headers: true
    sort_by: requests
    sort_dir: desc
    columns:
      - name: app_site_domain
        width: 260
        wrap: true
        label: Domain
      - pub_name
      - name: requests
        width: 120
        format_d3: ".3s"
        align: center
        delta:
          width: 80          # the Δ column shown while the widget compares
      - name: avg_bid_floor
        format_preset: currency_usd
| Property | Description |
|---|---|
fit_to_width | When the columns overflow the widget, every column without a configured width shrinks (down to its minimum) so the table fits instead of scrolling. Columns the viewer resizes keep their width. Defaults to false. |
wrap | Wrap the text of dimension cells over wrap_lines lines instead of truncating it. Measure cells never wrap. Defaults to false. |
wrap_headers | Wrap header labels over wrap_lines lines instead of truncating them. Defaults to false. |
wrap_lines | Lines per row, and per header row, when wrapping is on. Rows keep a uniform height; longer text is clipped with an ellipsis and the full value stays available in the hover tooltip. 1 to 5, defaults to 2. |
sort_by | Initial sort. In a table any column; in a pivot a measure (rows are ordered by its row total) or a row dimension. Viewers can still click a header to re-sort. |
sort_comparison | delta or percent_change: sort on the measure's comparison column instead of its value. Only for measures of the metrics view, and only while the widget shows a time comparison; otherwise the measure's value is sorted. Clicking a Δ or Δ% header in the editor writes it. |
sort_dir | asc or desc. Defaults to desc for measures and asc for dimensions. |
Per-column overrides on an entry:
| Key | Description |
|---|---|
name | Required. The dimension, measure, adhoc measure, or encoded time column, exactly as you would write the plain string. |
width | Pixel width. Measures accept 60 to 300, dimensions and time columns 100 to 600. A column with a configured width is pinned: stretching and fit_to_width leave it alone. |
wrap | Overrides the component-level wrap for one dimension column. |
align | left, center, or right for the header and cells of table columns and measures. Measures default to right, dimensions to left. Row dimensions and column dimensions do not take it. |
label | Header text, replacing the display name from the metrics view. In a pivot it also renames the field in the merged row-header label and the column-dimension group header. |
format_preset | Number format for a measure in this widget only: humanize, none, currency_usd, currency_eur, percentage, or interval_ms. Mutually exclusive with format_d3. |
format_d3 | A d3 format string for a measure in this widget only, such as .3s for three significant digits or ,.2f. Mutually exclusive with format_preset. |
delta, percent_change | Overrides for the measure's Δ and Δ% comparison columns, which appear while the widget shows a time comparison: an object with width (60 to 300). Only on measures of the metrics view, as adhoc measures have no comparison columns. Dragging a Δ or Δ% column edge in the editor writes it. |
In a pivot, only measures and the first row dimension render a column of their own. A measure's width applies to its column under every column-dimension value, and the first row dimension's width and wrap apply to the merged row-header column; row dimensions after the first take only name and label, and row dimensions never take align. Entries in col_dimensions are header groups spanning their measure columns, so they accept only name and label; to make a pivoted group wider, widen its measures. Sorting by a measure orders the rows by that measure's row total.
In the canvas editor, the widget's sidebar has switches for fitting and wrapping and a sort selector, and each field chip opens a column settings menu with the label, width, wrapping, alignment, and number format. Dragging a column edge in the editor writes the width to the YAML, and clicking a header writes the sort. Viewers of the published dashboard can still resize and re-sort; their changes are not saved.
Adhoc measures
Tables, pivots, KPIs, KPI grids, leaderboards, and charts can define their own adhoc measures with adhoc_measures. An adhoc measure combines the metrics view's measures with an arithmetic expression, and you reference it by name wherever the widget accepts a measure.
- pivot:
    metrics_view: sales_metrics
    row_dimensions:
      - region
    measures:
      - revenue
      - margin_pct
    adhoc_measures:
      - name: margin_pct
        display_name: Margin %
        expression: (revenue - cost) / revenue
        format_preset: percentage
In the canvas editor, select Create adhoc measure at the bottom of a widget's measure selector to open the same dialog as in Explore dashboards. Rill writes the definition to the widget's adhoc_measures, and the measure selector shows an edit action next to it.
| Property | Description |
|---|---|
name | Required. The name you reference in measures, columns, or a chart field. It must start with a letter, contain only letters, numbers, and underscores, and not match a dimension or measure in the metrics view. |
expression | Required. An arithmetic expression over the metrics view's measure names. See the expression reference. |
display_name | The label shown in the widget. Defaults to name. |
format_preset | One of humanize (default), none, currency_usd, currency_eur, or percentage. |
description | Text shown in the measure's tooltip instead of the expression. |
Adhoc measures belong to a single widget: to use the same calculation in two widgets, define it in both. When you write adhoc_measures by hand, follow the same rules as the editor:
- Reference only measures that don't use a window function, don't have required dimensions, and aren't time-comparison measures.
- Don't end a
namewith a comparison suffix, such as_prev,_delta,_delta_perc, or_percent_of_total, and don't include_rill_in it. - Define at most 10 adhoc measures per widget.
For a calculation that many widgets or dashboards share, add a measure to the metrics view instead.
Navigation
All Data widgets also provide a button to "Go to explore" that can navigate to the Explore dashboard if available.