Canvas Dashboards using Vega Lite
Let's continue with another custom component example.
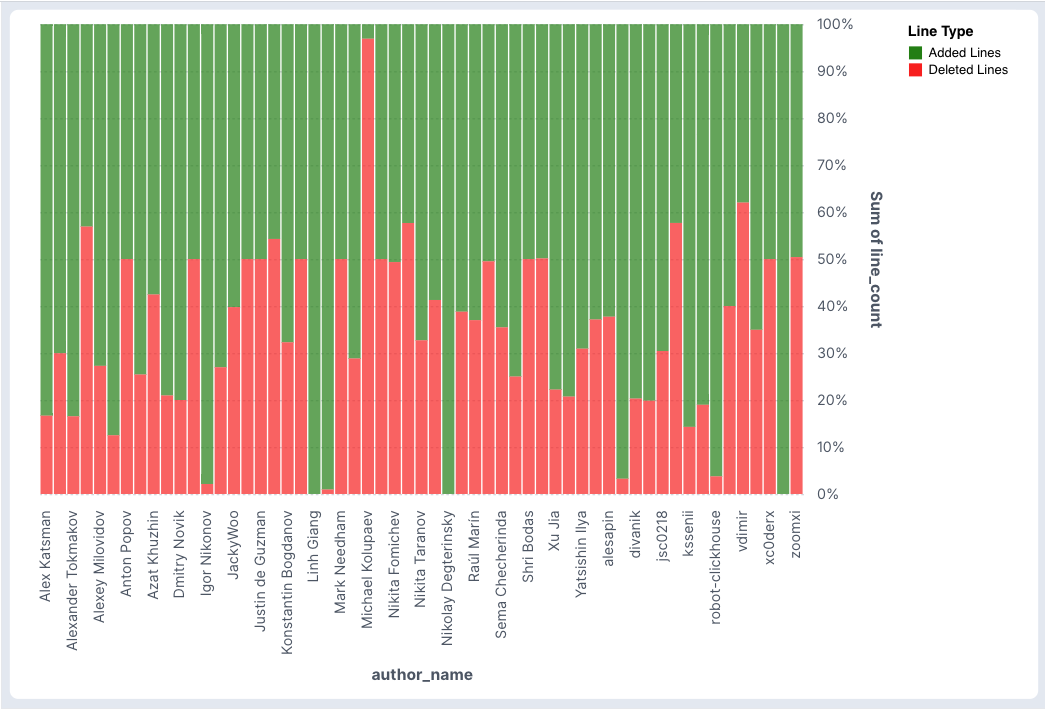
Let's say we want to see each user's addition and deletion of code over a set period in an easy to read way. Looking through Vega Lite's example gallery, we can see that a Normalized Stacked Bar chart does this quite well.
Creating a normalized stacked bar chart for addition vs deletion to repository
Let's use the advanced_commits__model table to obtain our data.
The advanced_commits_model file is created with the following contents, assuming you have already imported the data from the first page.
Click me for SQL
-- Model SQL
-- Reference documentation: https://docs.rilldata.com/reference/project-files/models
-- @materialize: true

WITH commit_file_stats AS (
    SELECT
        a.*,
        b.filename,
        b.added_lines,
        b.deleted_lines,
        REGEXP_EXTRACT(b.new_path, '(.*/)', 1) AS directory_path,
    FROM
        commits__ a
    inner JOIN
        modified_files__ b
    ON
        a.commit_hash = b.commit_hash
)
SELECT
    author_date,
    author_name,
    directory_path,
    filename,
    STRING_AGG(DISTINCT commit_msg, ', ') AS commit_msg,

    COUNT(DISTINCT commit_hash) AS num_commits,
    SUM(added_lines) - SUM(deleted_lines) AS net_line_changes,
    SUM(added_lines) + SUM(deleted_lines) AS total_line_changes,

    -- (SUM(deleted_lines) / (SUM(added_lines) + SUM(deleted_lines))) as CodeDeletePercent,
    sum(added_lines) as added_lines,
    sum(deleted_lines) as deleted_lines,

FROM
    commit_file_stats
WHERE
    directory_path IS NOT NULL
GROUP BY
    --directory_path, filename, author_name, author_date
    ALL
ORDER BY
    directory_path DESC
Preparing the Data
In order to calculate the percentage of added vs deleted lines of code to the repository, we will need to include both added_lines and deleted_lines to the SELECT statement. As we will be grouping by the author, we will also need author_name.
Click me for SQL
data:
  sql: |
    select
      author_name,
      sum(added_lines) as added_lines,
      sum(deleted_lines) as deleted_lines,
    from advanced_commits___model
    where author_date > '2024-07-21 00:00:00 Z'
    group by author_name
Preparing the Visuals
Navigating back to Vega Lite documentation, we will see that the requirements to create this type of chart is different. We have a transform section as well as more items in the y-axis.
For further detailed explanation, I would recommened reviewing the Vega Lite documentation. For now, understand that the following component folds the data into [author_name, added_lines, deleted_lines] and is using the data to compare the number of lines added/deleted.
Click me for component
vega_lite: |
  {
    "$schema": "https://vega.github.io/schema/vega-lite/v5.json",
    "data": {"name": "table"},
    "width": "container",
    "height": 360,
    "transform": [
        {
          "fold": ["added_lines", "deleted_lines"],
          "as": ["line_type", "line_count"]
        },
        {
          "calculate": "datum.line_type === 'added_lines' ? 'Added Lines' : 'Deleted Lines'",
          "as": "Line Type"
        }
      ],
    "mark": "bar",
    "encoding": {
      "x": {
        "field": "author_name",
        "type": "nominal"
      },
      "y": {
        "aggregate": "sum",
        "field": "line_count",
        "type": "quantitative",
        "stack": "normalize"
      },
        "color": {
          "field": "Line Type",
          "type": "nominal",
          "scale": {
            "domain": ["Added Lines", "Deleted Lines"],
            "range": ["green", "red"]
            }
          }
        }
    }
Custom Component Complete
With both components ready, your dashboard should look something like this:
# Component YAML
# Reference documentation: https://docs.rilldata.com/reference/project-files/components

type: component

data:
  sql: |
    select
      author_name,
      sum(added_lines) as added_lines,
      sum(deleted_lines) as deleted_lines,
    from advanced_commits___model
    where author_date > '2024-07-21 00:00:00 Z'
    group by author_name


vega_lite: |
  {
    "$schema": "https://vega.github.io/schema/vega-lite/v5.json",
    "data": {"name": "table"},
    "width": "container",
    "height": 360,
    "transform": [
        {
          "fold": ["added_lines", "deleted_lines"],
          "as": ["line_type", "line_count"]
        },
        {
          "calculate": "datum.line_type === 'added_lines' ? 'Added Lines' : 'Deleted Lines'",
          "as": "Line Type"
        }

      ],
    "mark": "bar",
    "encoding": {
      "x": {
        "field": "author_name",
        "type": "nominal"
      },
      "y": {
        "aggregate": "sum",
        "field": "line_count",
        "type": "quantitative",
        "stack": "normalize"
      },
        "color": {
          "field": "Line Type",
          "type": "nominal",
          "scale": {
            "domain": ["Added Lines", "Deleted Lines"],
            "range": ["green", "red"]
            }
          }
        }
    }
Was this content helpful?