Filtering the Canvas Dashboards
Filtering the dashboard can be done via components. For information on input, output and variables, please see [our documentation] ().
Creating a Selector Component
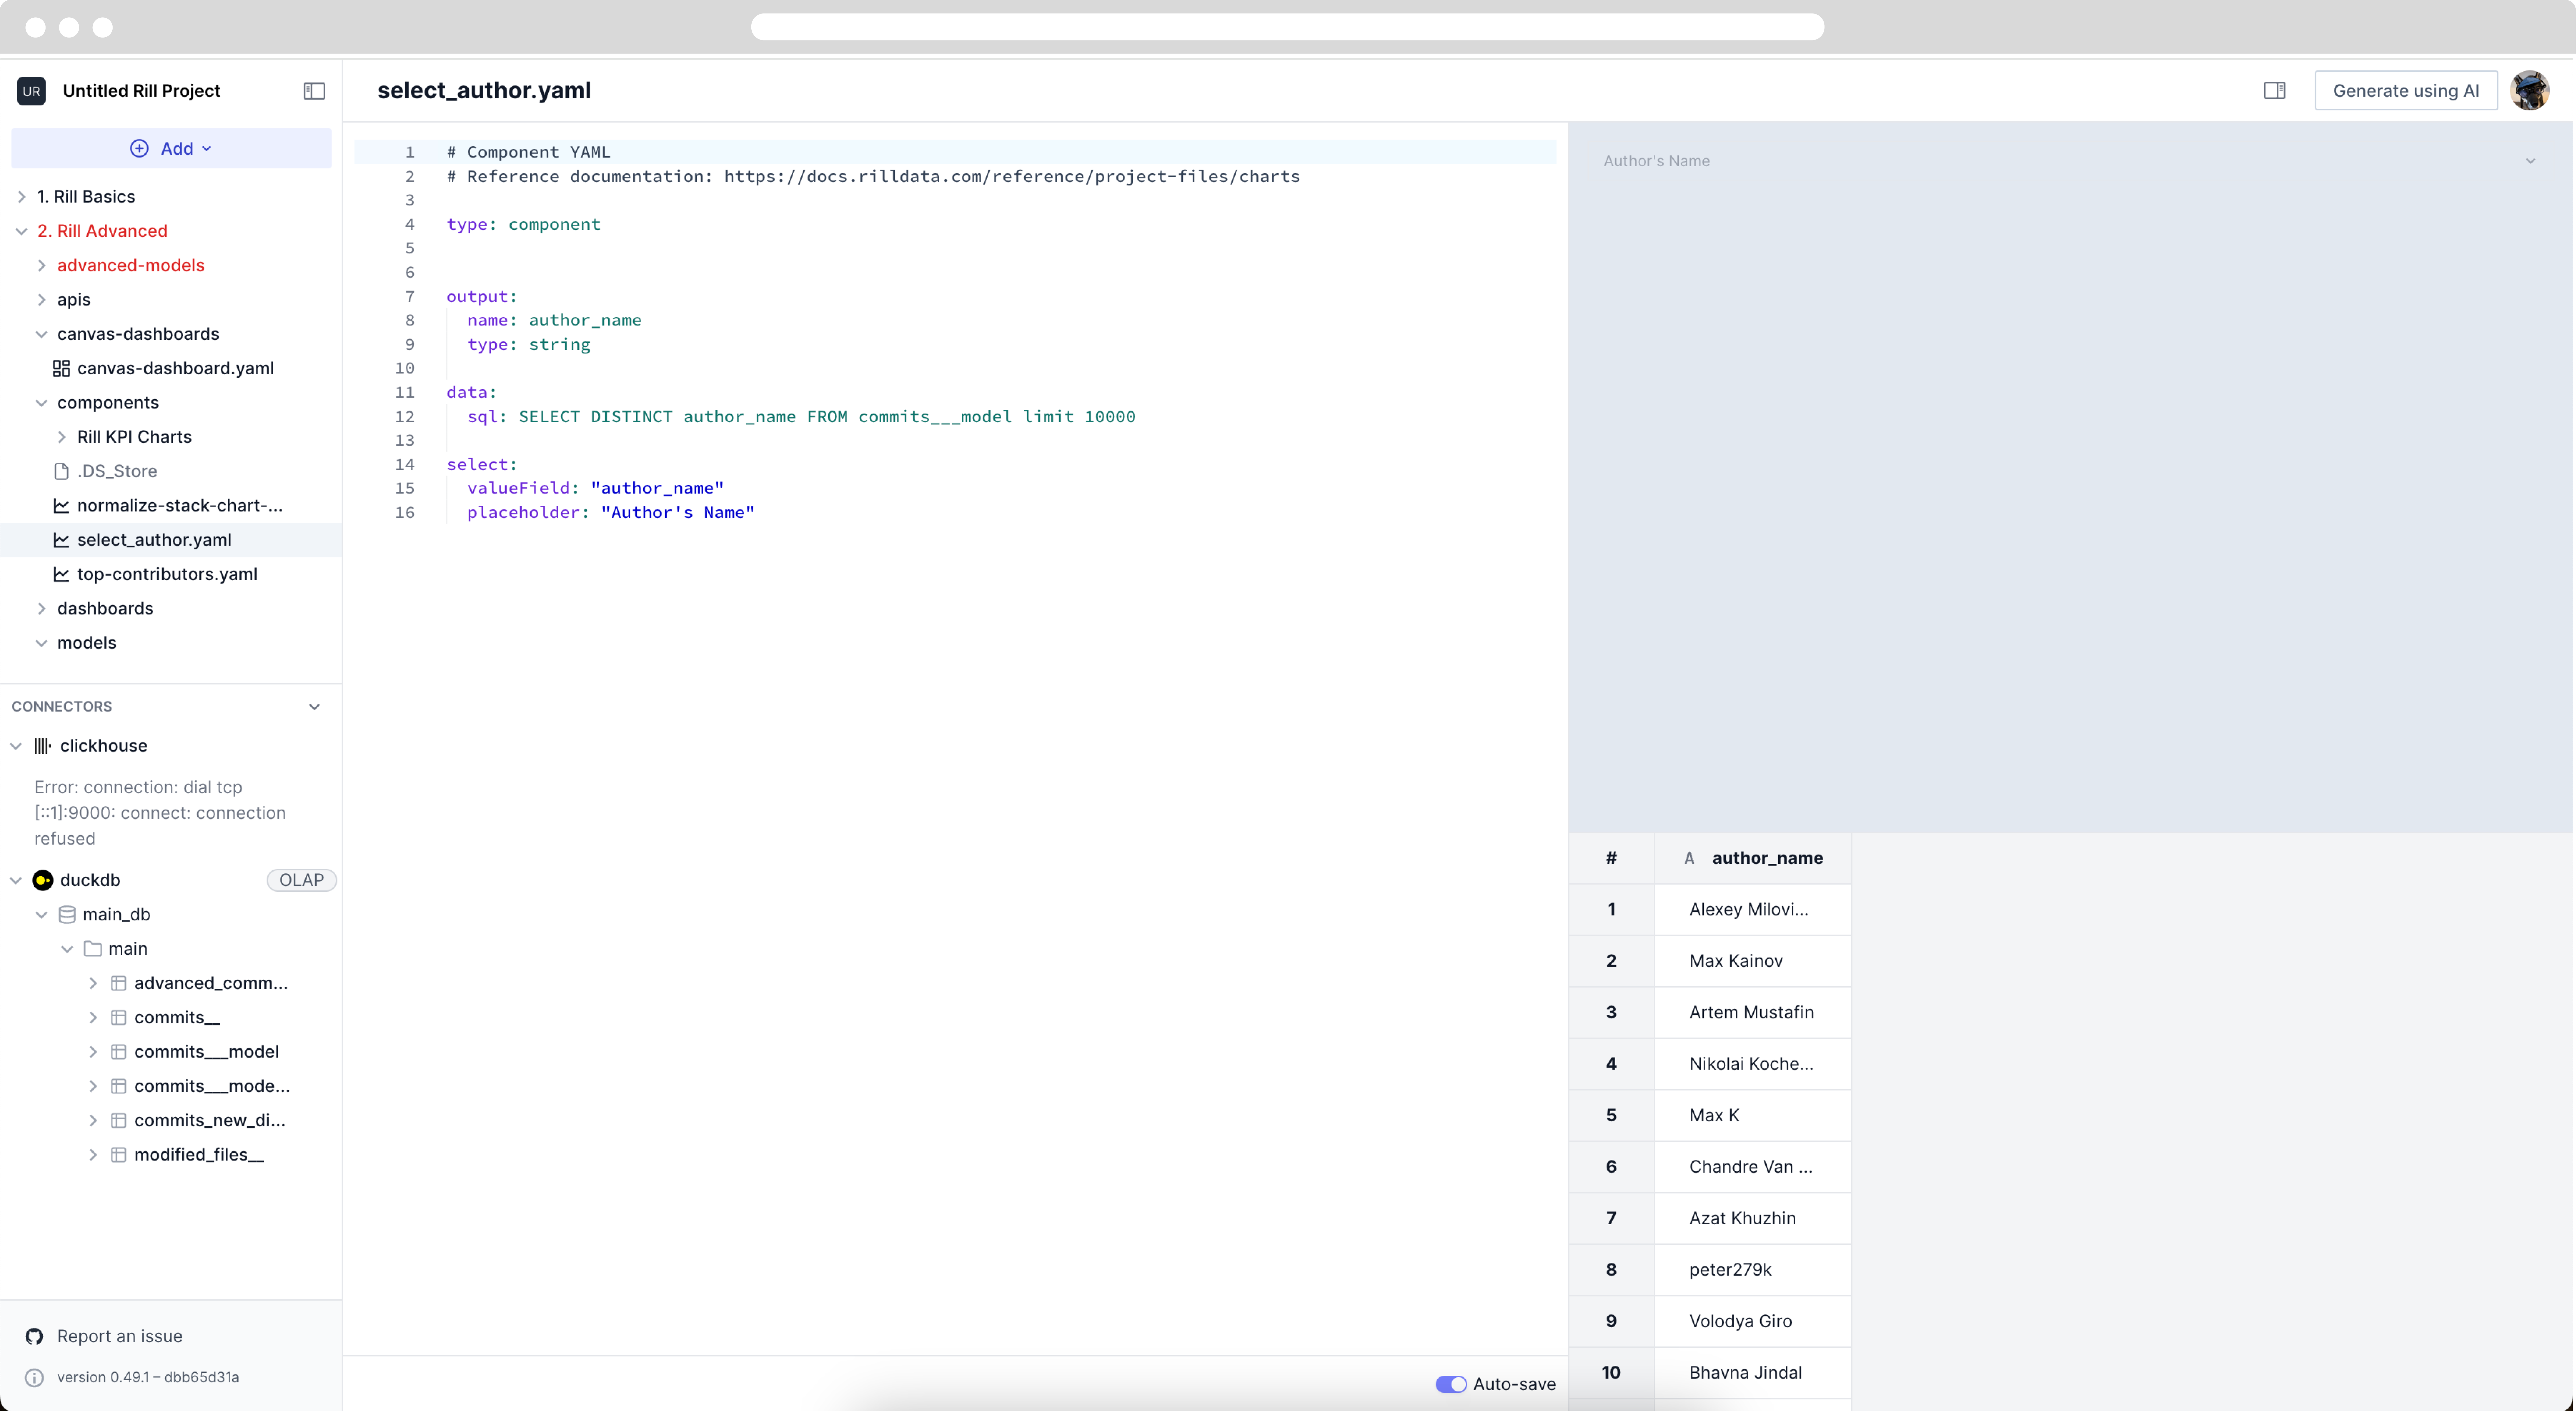
For our example, we will create a selector component that filters on the distinct values in the author_name column in our commits___model model.
A few things to note, since this component will be used as an input into other components, we define the output parameter. There's a hard limit of 10,000 rows.
# Component YAML
# Reference documentation: https://docs.rilldata.com/reference/project-files/components

type: component

output:
  name: author_name
  type: string

data:
  sql: SELECT DISTINCT author_name FROM commits___model limit 10000

select:
  valueField: "author_name"
  placeholder: "Author's Name"
We can now add the component to our dashboard. Selecting you'll see the distinct authors listed. However, selecting an author doesnt change the dashboards, why? This is because we haven't set the input in the component's YAML.

Defining the input from the Selector
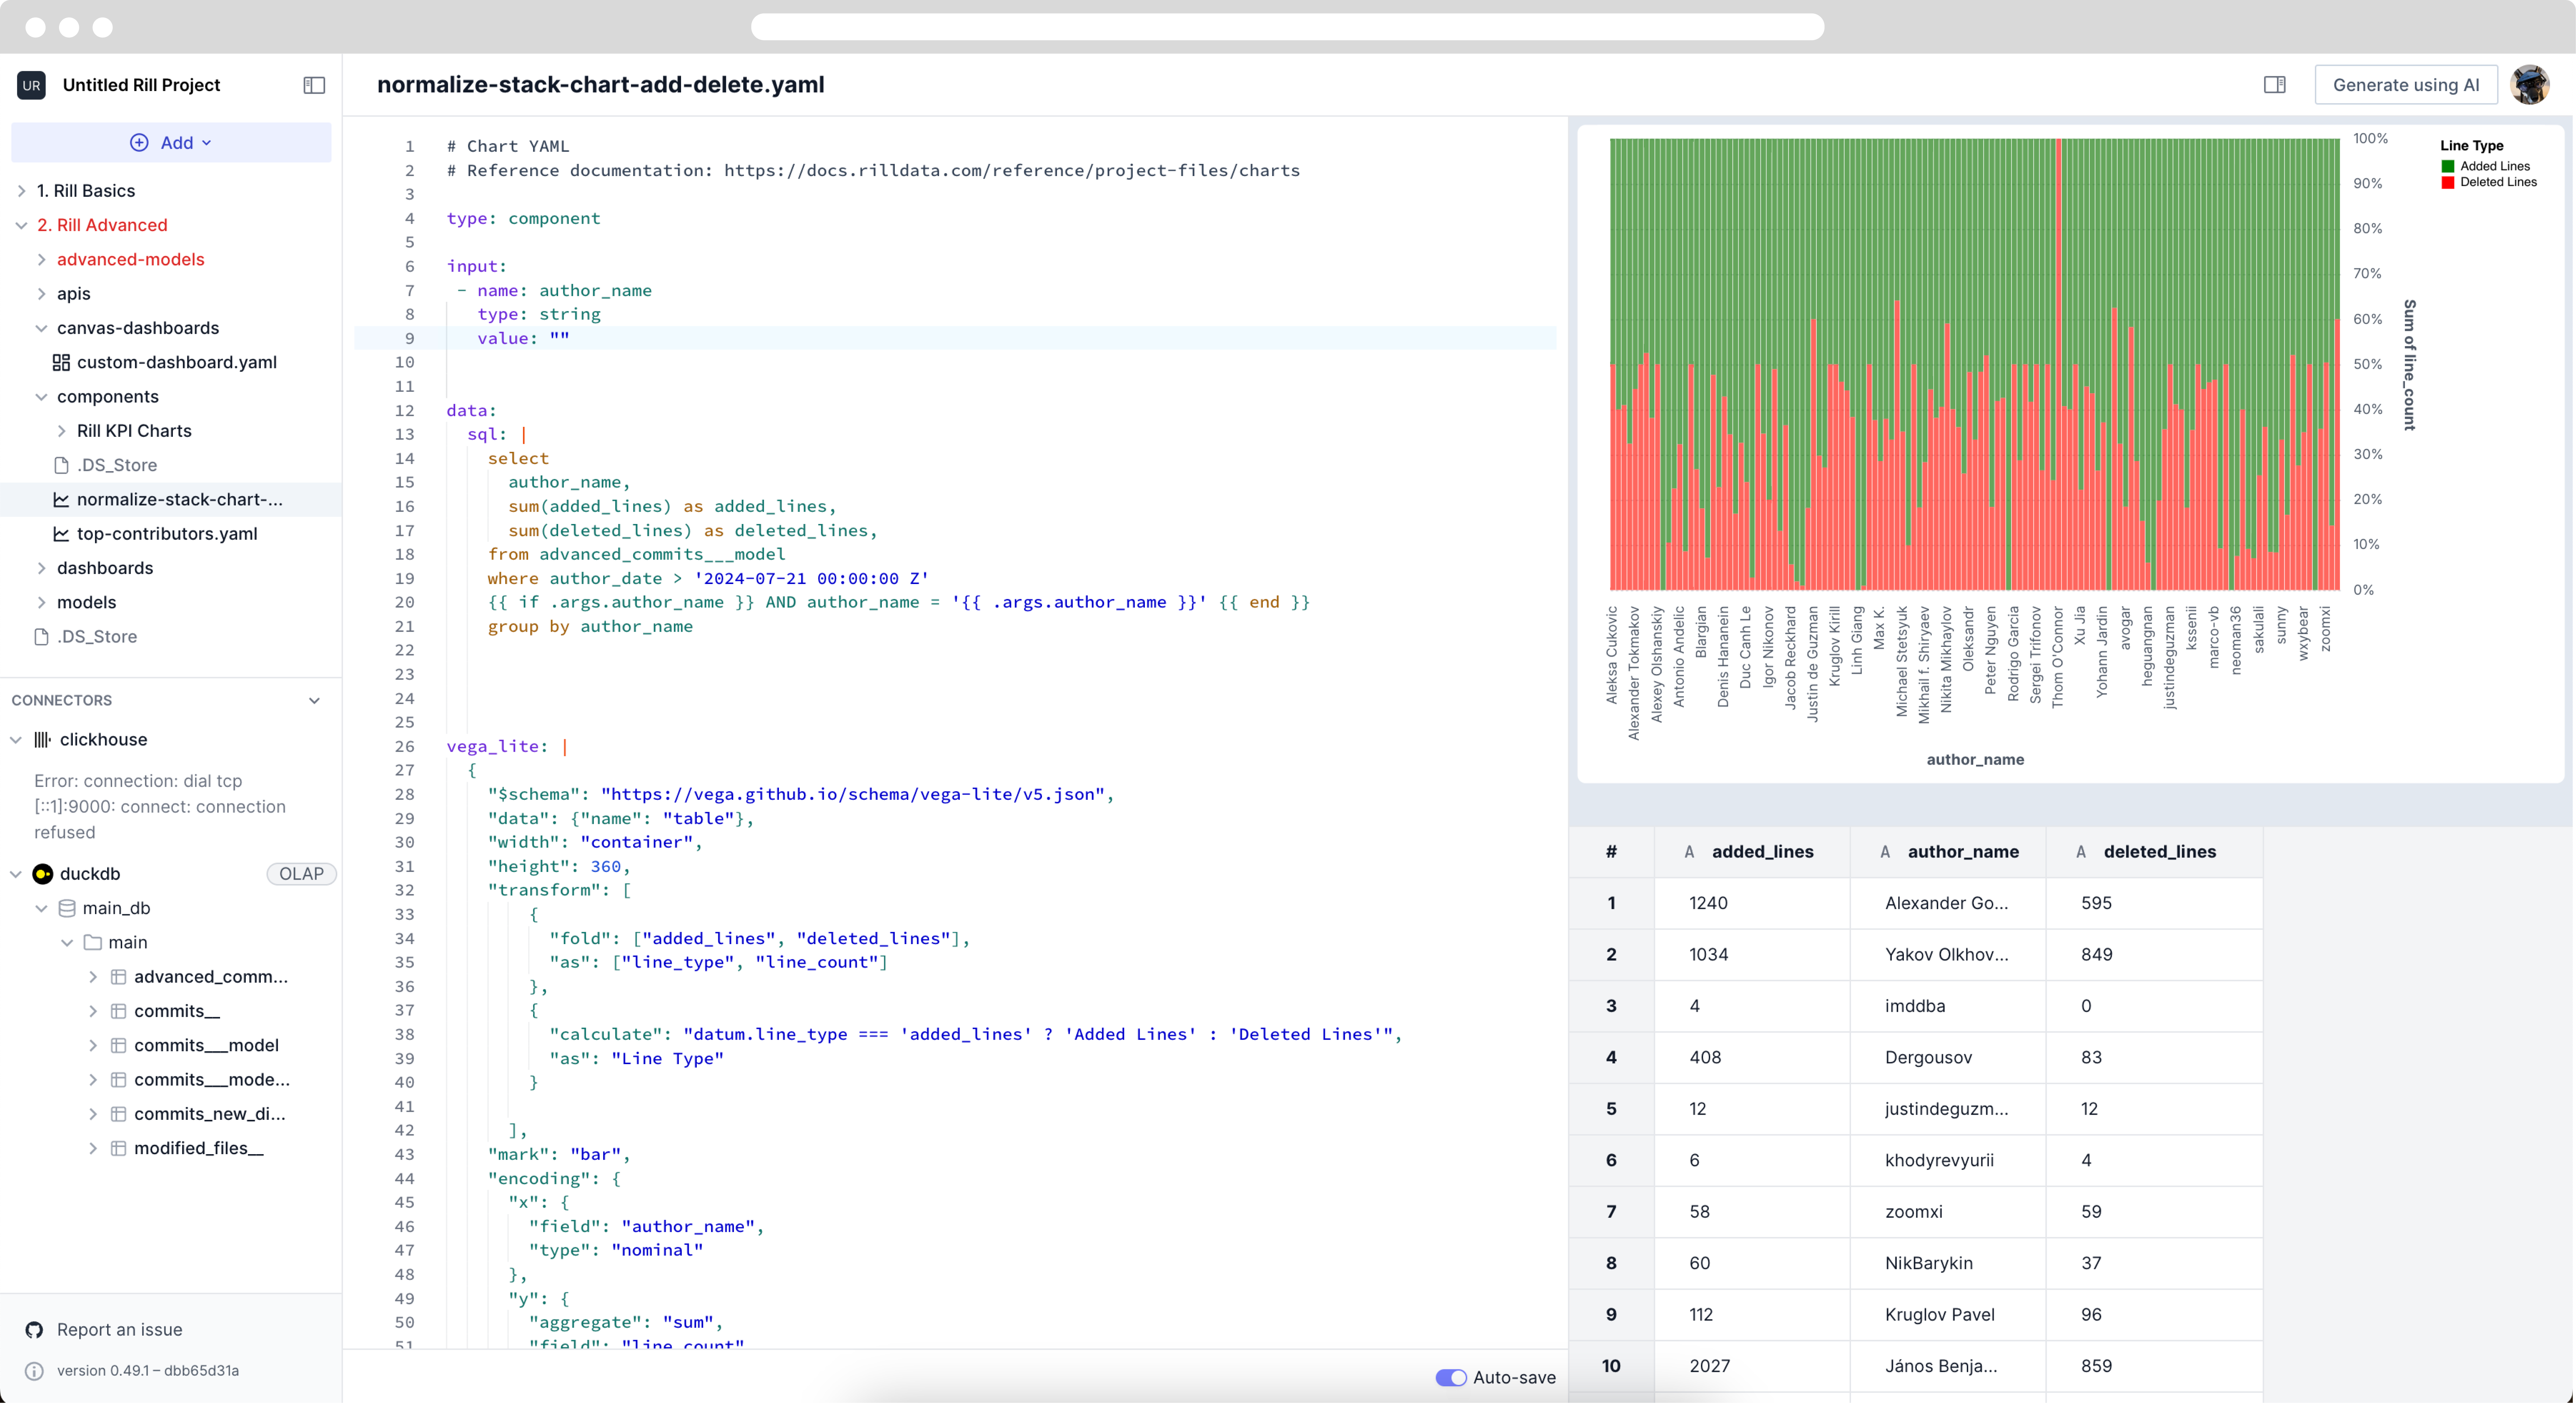
Using the stacked bar chart, let's define the input from the selector's output parameter.
...
input:
 - name: author_name
   type: string
   value: ""


data:
  sql: |
    select
      author_name,
      sum(added_lines) as added_lines,
      sum(deleted_lines) as deleted_lines,
    from advanced_commits___model
    where author_date > '2024-07-21 00:00:00 Z'
    {{ if .args.author_name }} AND author_name = '{{ .args.author_name }}' {{ end }}
    group by author_name
...
Let's take a second to understand the SQL. We are checking that if the author_name argument exists, we wil append AND author_name... to the SQL query. As we have defined value as "", this author_name is not being used.

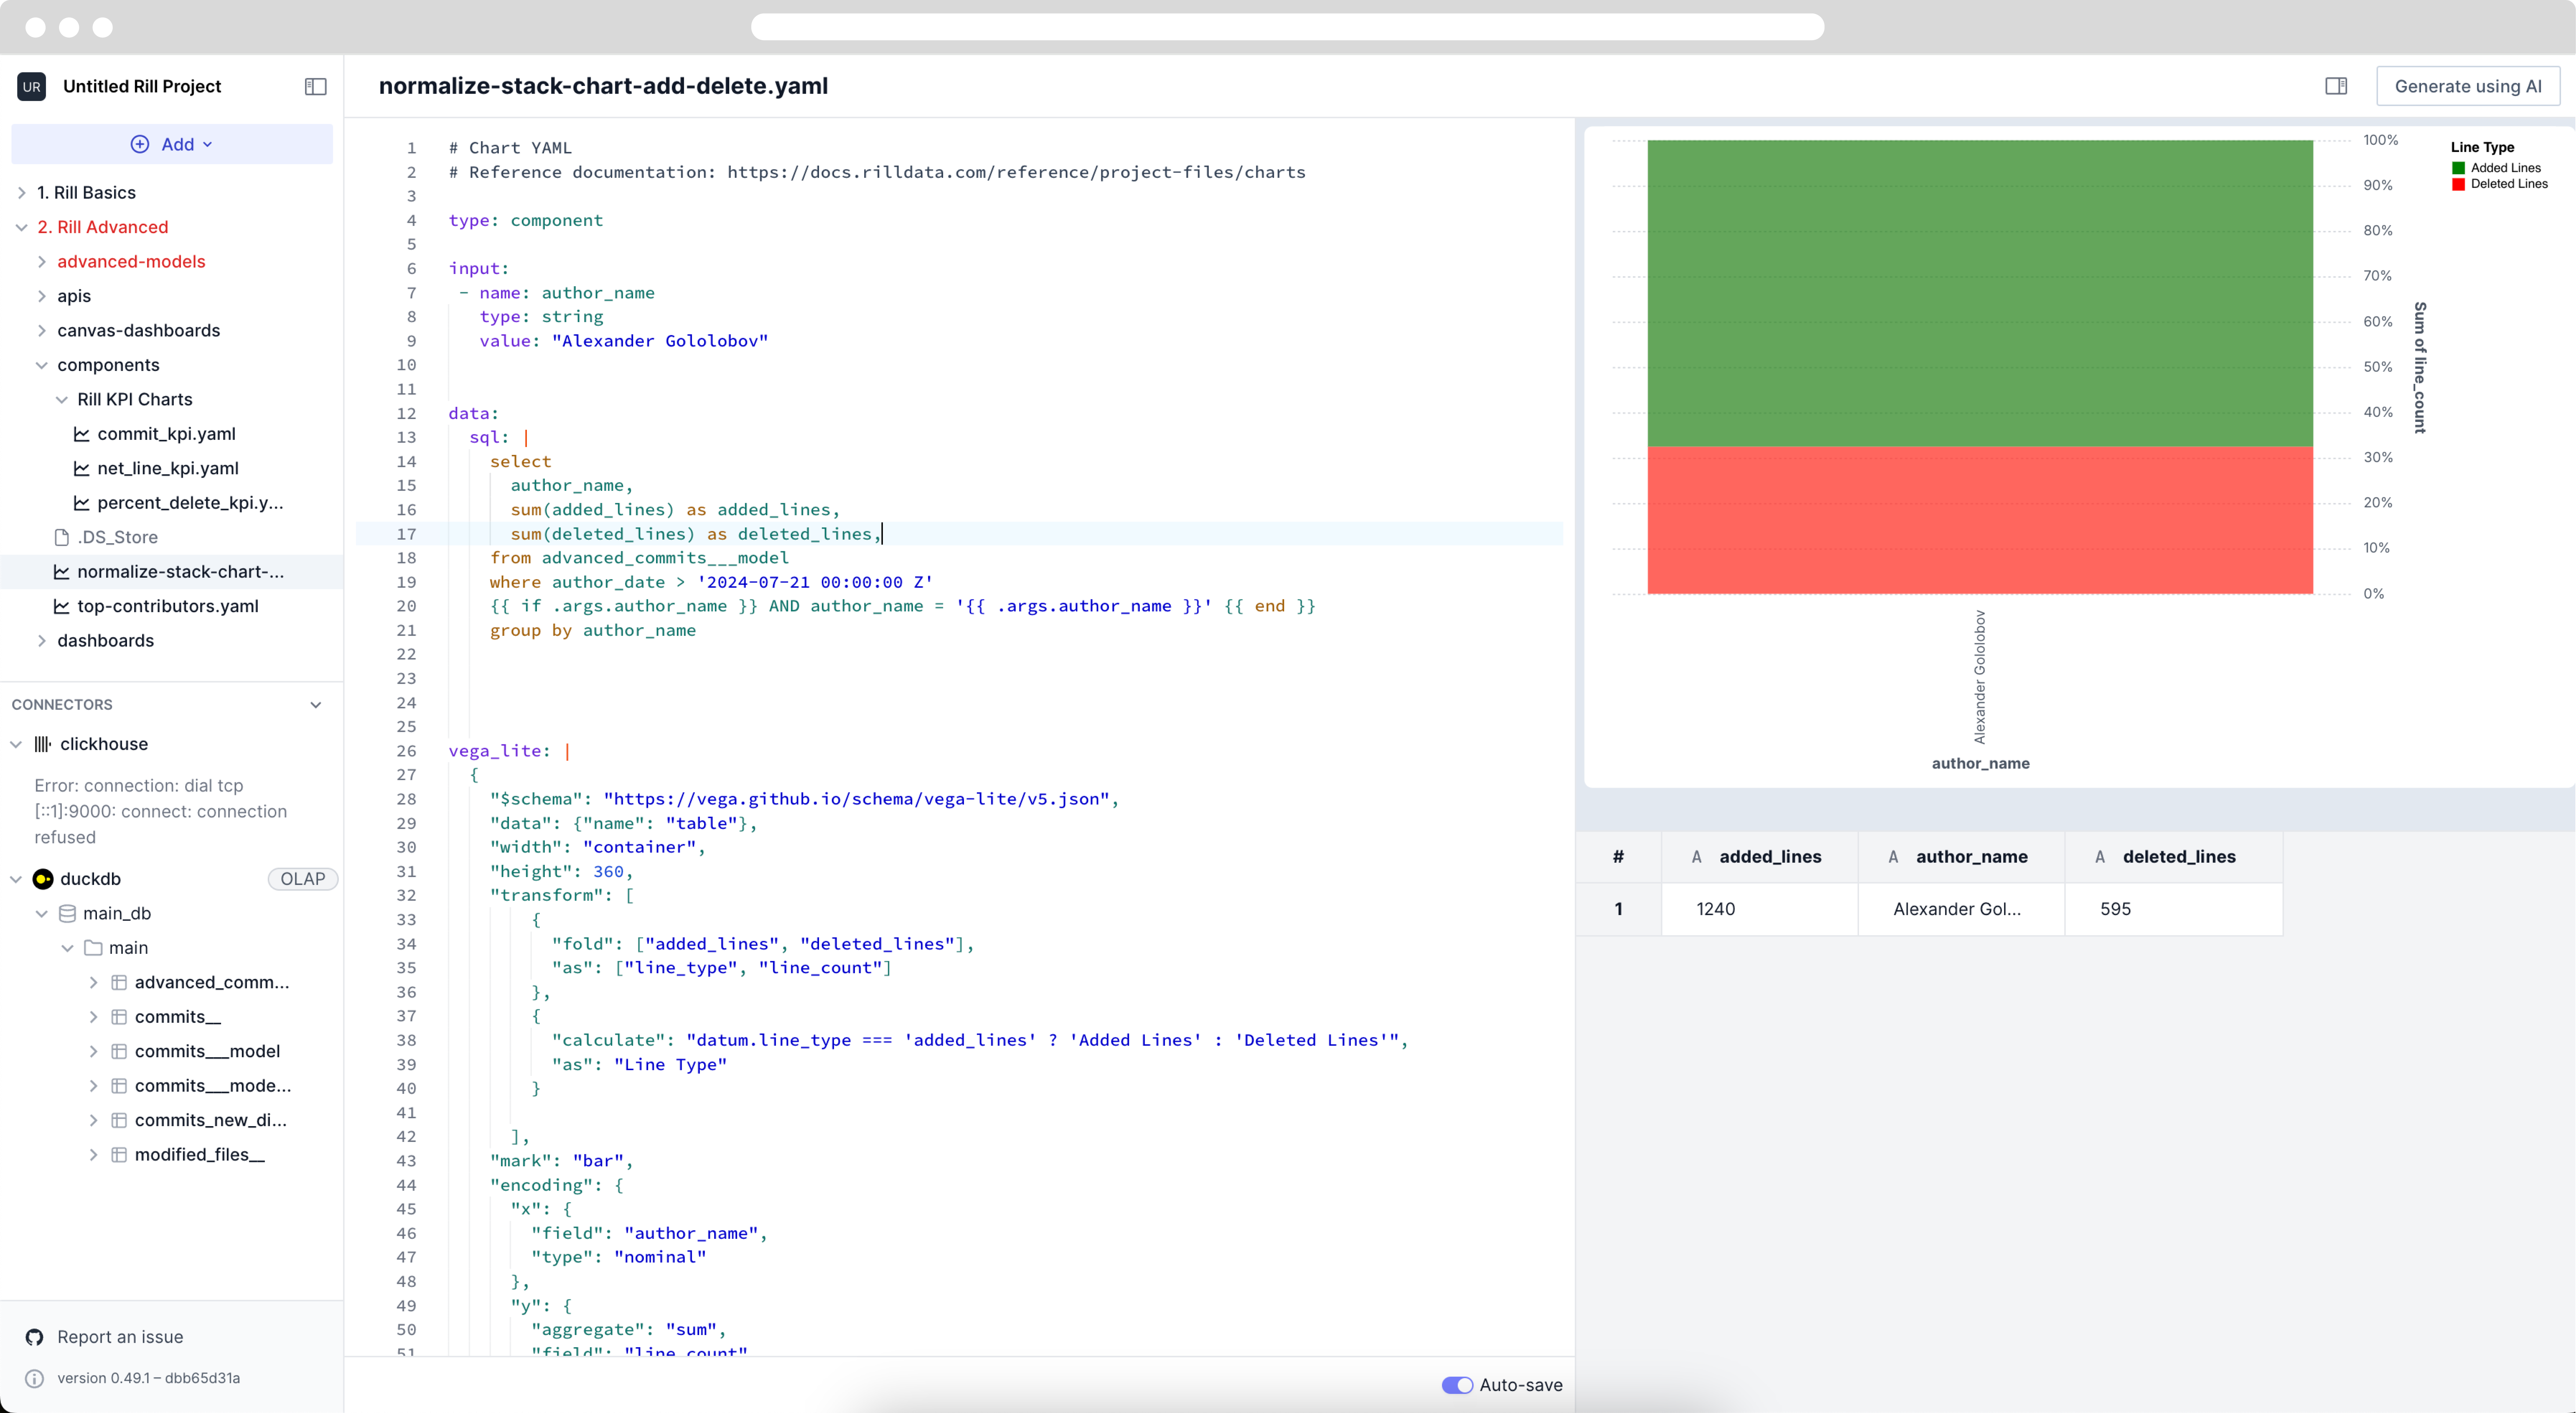
However, you can see that if we add an actual author to this key-pair the chart changes.

Let's change it back to the original empty value as we do not want to default on the single author view. Now let's navigate back to the canvas dashboard and add the variables to be used.
type: dashboard
columns: 13
gap: 2

variables:
  - name: author
    type: string
    value: ""

  - name: timegrain
    type: string
    value: "P1W" #you can also define a default value for the variable

items:
  - component:
      markdown:
        content: "ClickHouse Repo Overview"
...
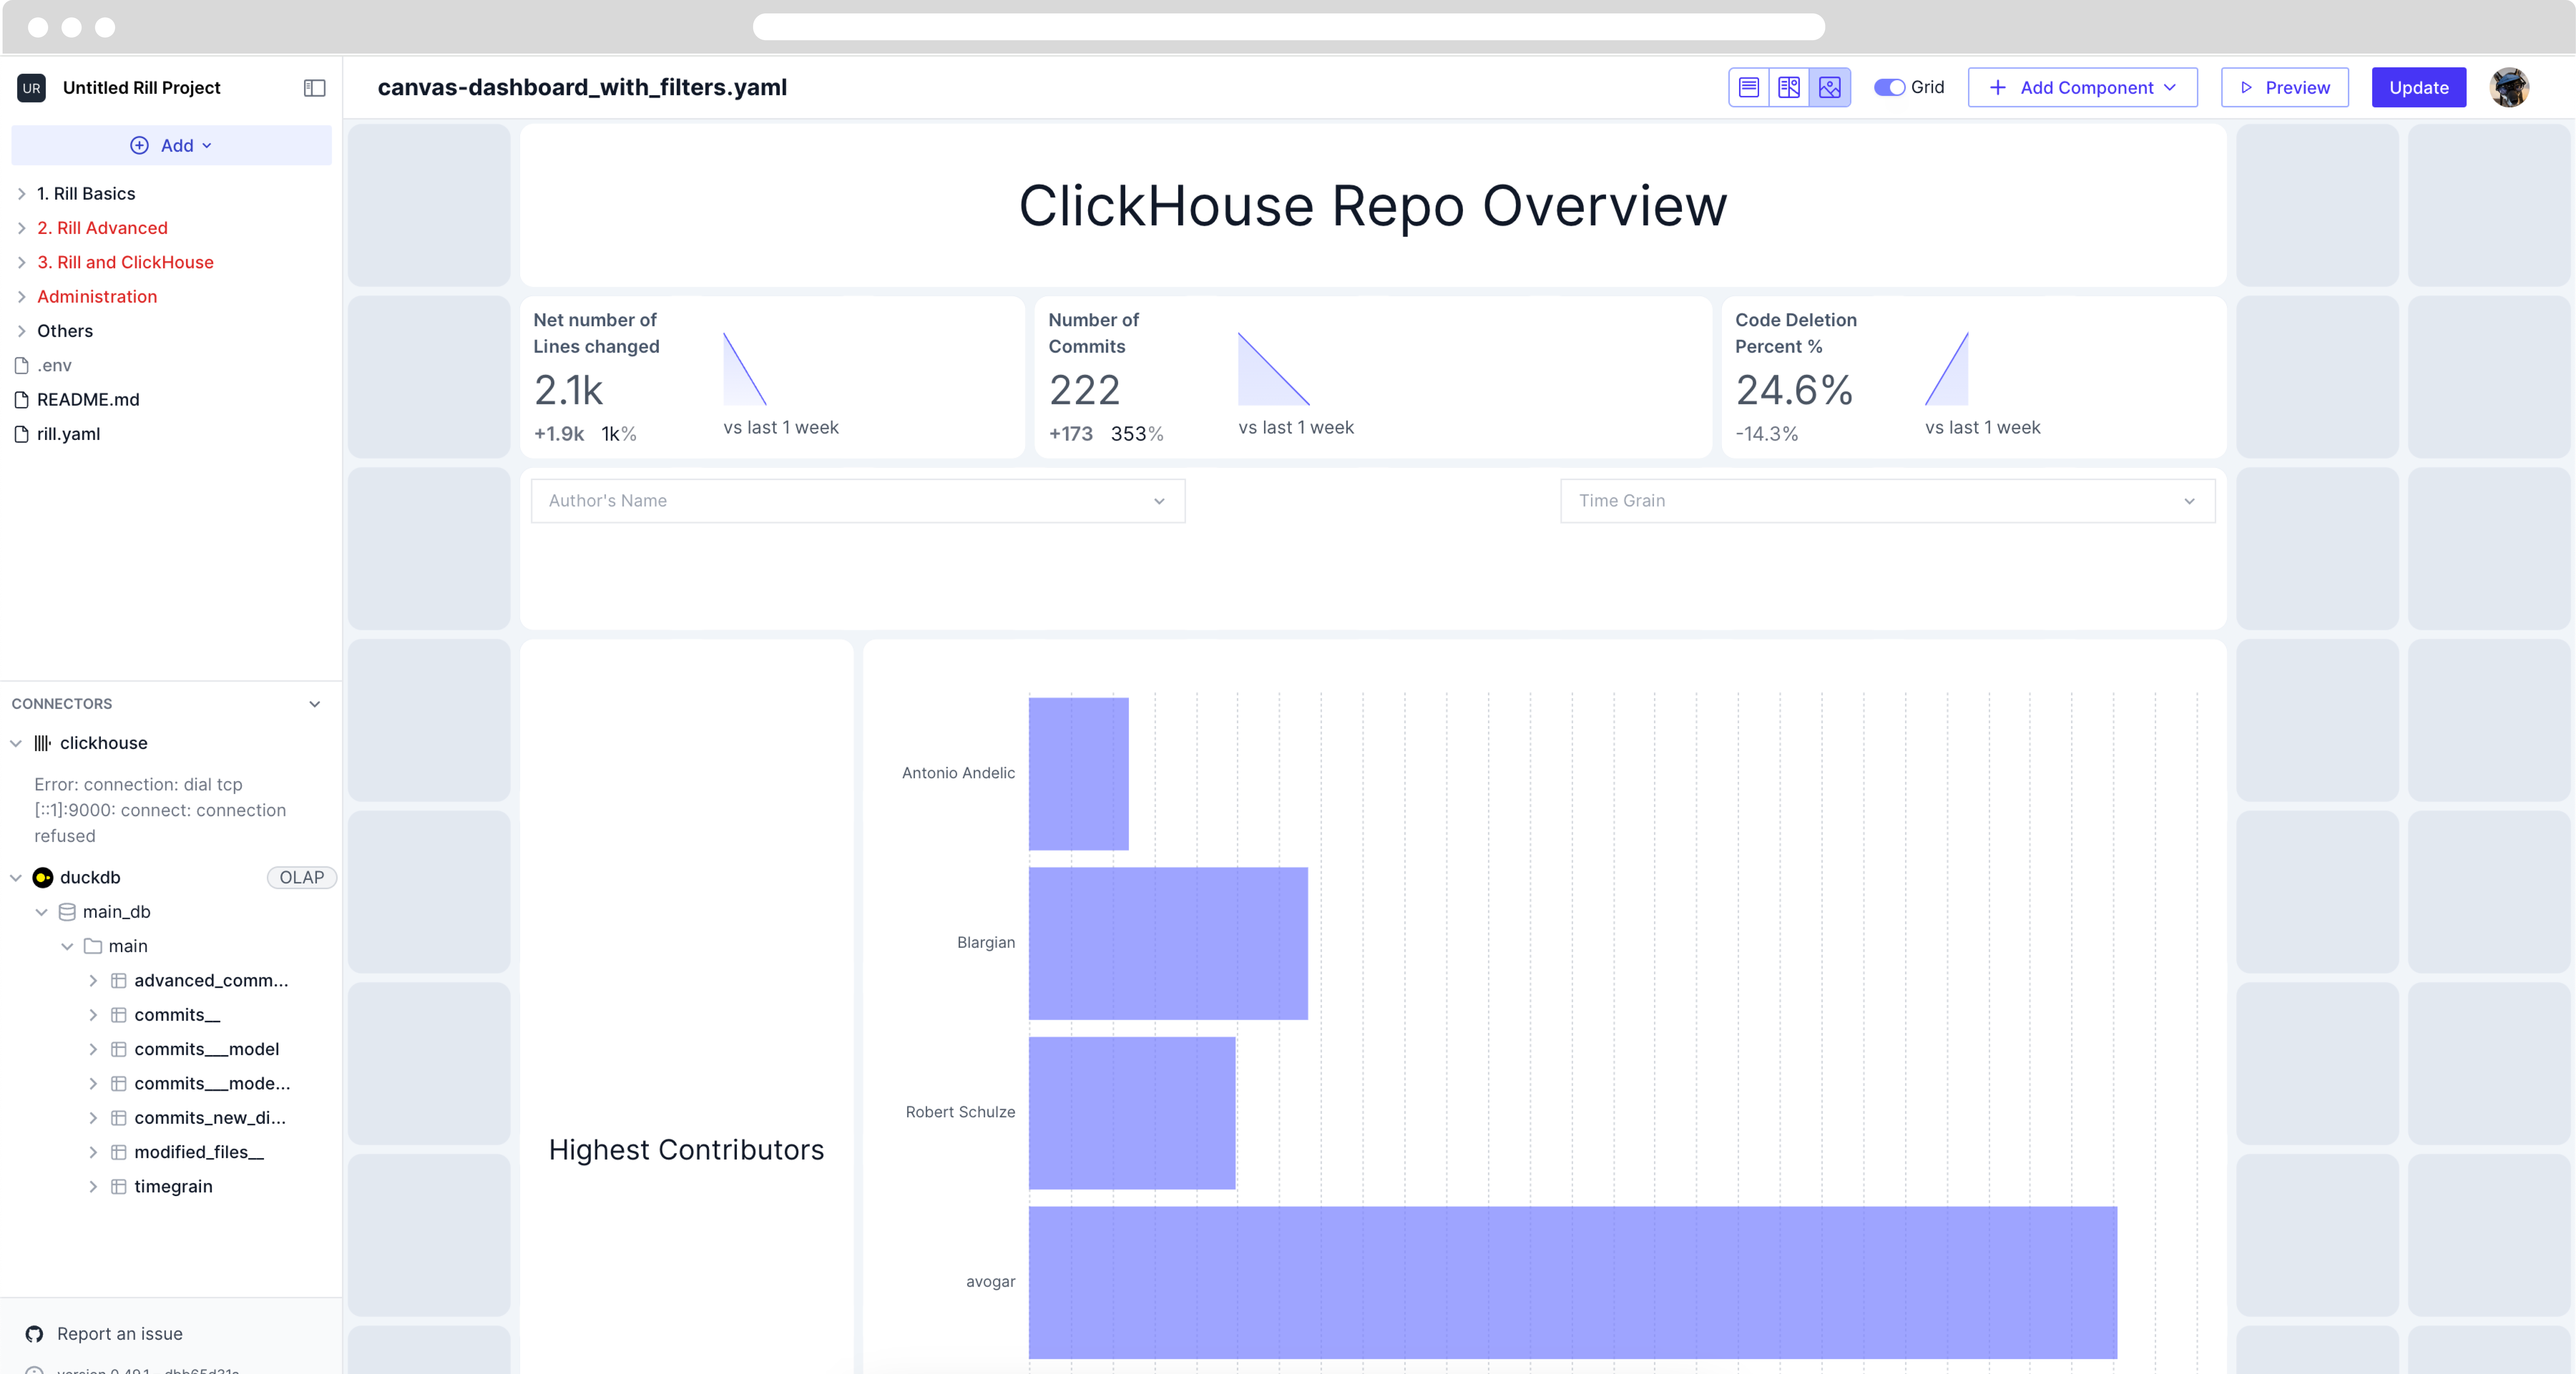
Now upon selection of the author dropdown, we can see the stacked bar chart change. You can make the same changes to the Highest Contributor chart, as well. See below for a sample of a completed canvas dashboard.

Was this content helpful?