Multiple Measure Leaderboard
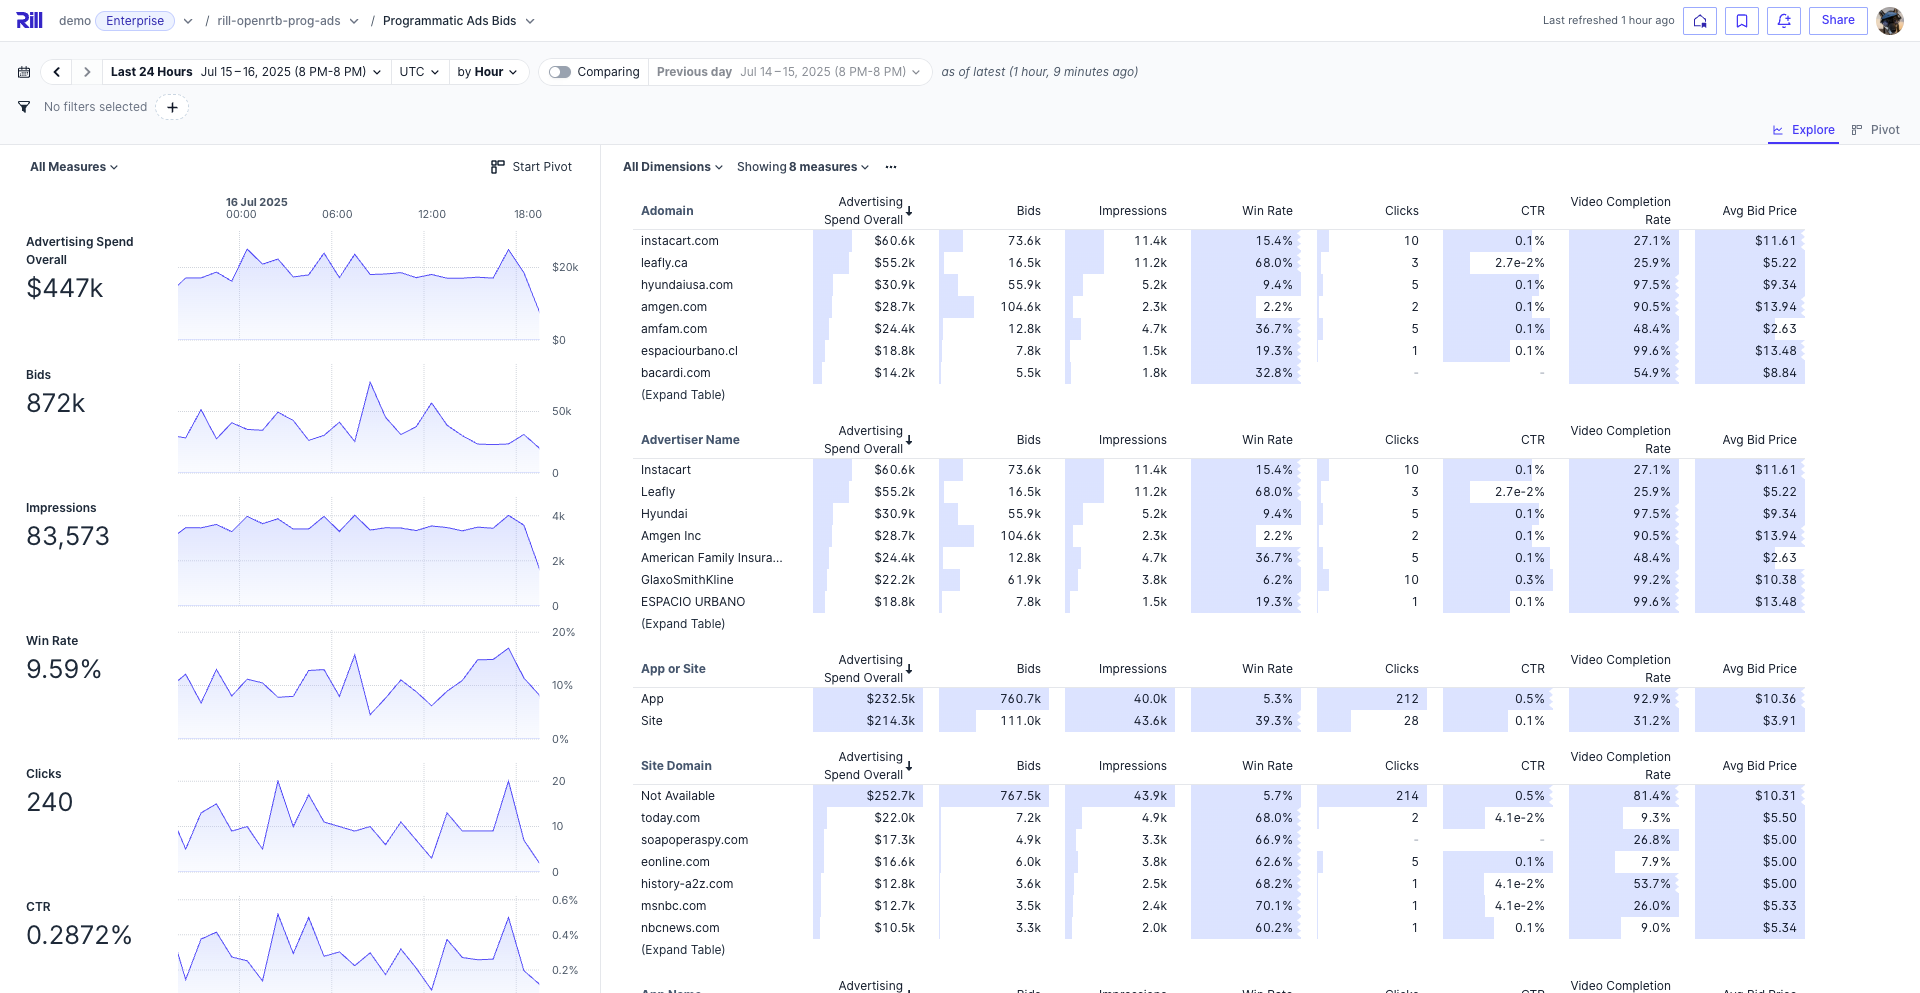
By default, the Explore dashboard displays a single measure for each dimension in the leaderboard. However, there are many cases where comparing multiple measures side-by-side can provide deeper insights.
Prefer video? Check out our YouTube playlist for a quick start!
Benefits of Multiple Measure Dashboards
With the Multiple Measure Leaderboard feature, you can easily select and compare several measures for any dimension. Simply open the dropdown in the dimension leaderboard, enable multi-select, and choose any combination of visible measures to display them together.
Why Compare Multiple Measures?
Comparing multiple measures at once allows you to:
- Spot correlations between different metrics for the same dimension.
- Quickly identify outliers or trends that may not be obvious when viewing a single measure.
- Make more informed decisions by seeing the full context of your data.