Using Natural lanugage to Create Components for Canvas Dashboards
While we specialize in time-series charts on our Explore and Pivot view, we understand that there is always a need for a more customized view for specific individuals or groups. However, writing out specs to create a picture-perfect dashboard can be time-consuming.
In this guide, we will go over the steps to create your own custom components using natural language to create a unique canvas dashboard. You can follow along with the rill-openrtb-prog-ads project in our Rill Examples repository.
Rill Components
Rill Components are developed in Rill Developer and are used as single units within a Canvas Dashboard. Please review our documentation on Canvas Dashboards or the Advanced Features walkthrough for more information on this concept.
Creating a Component Overview
In order to create a component in Rill you need to define the following :
type - component (required)
data - This section defines which data should be exposed to the component. Various different data resolvers are available such as metrics_sql, api and sql (required)
renderer - This defines the visualization spec, can be vega_lite, or any Rill Authored Component
In this example, as we will be using the natural language to create our component we will use the vega_lite: renderer.
Create a Component
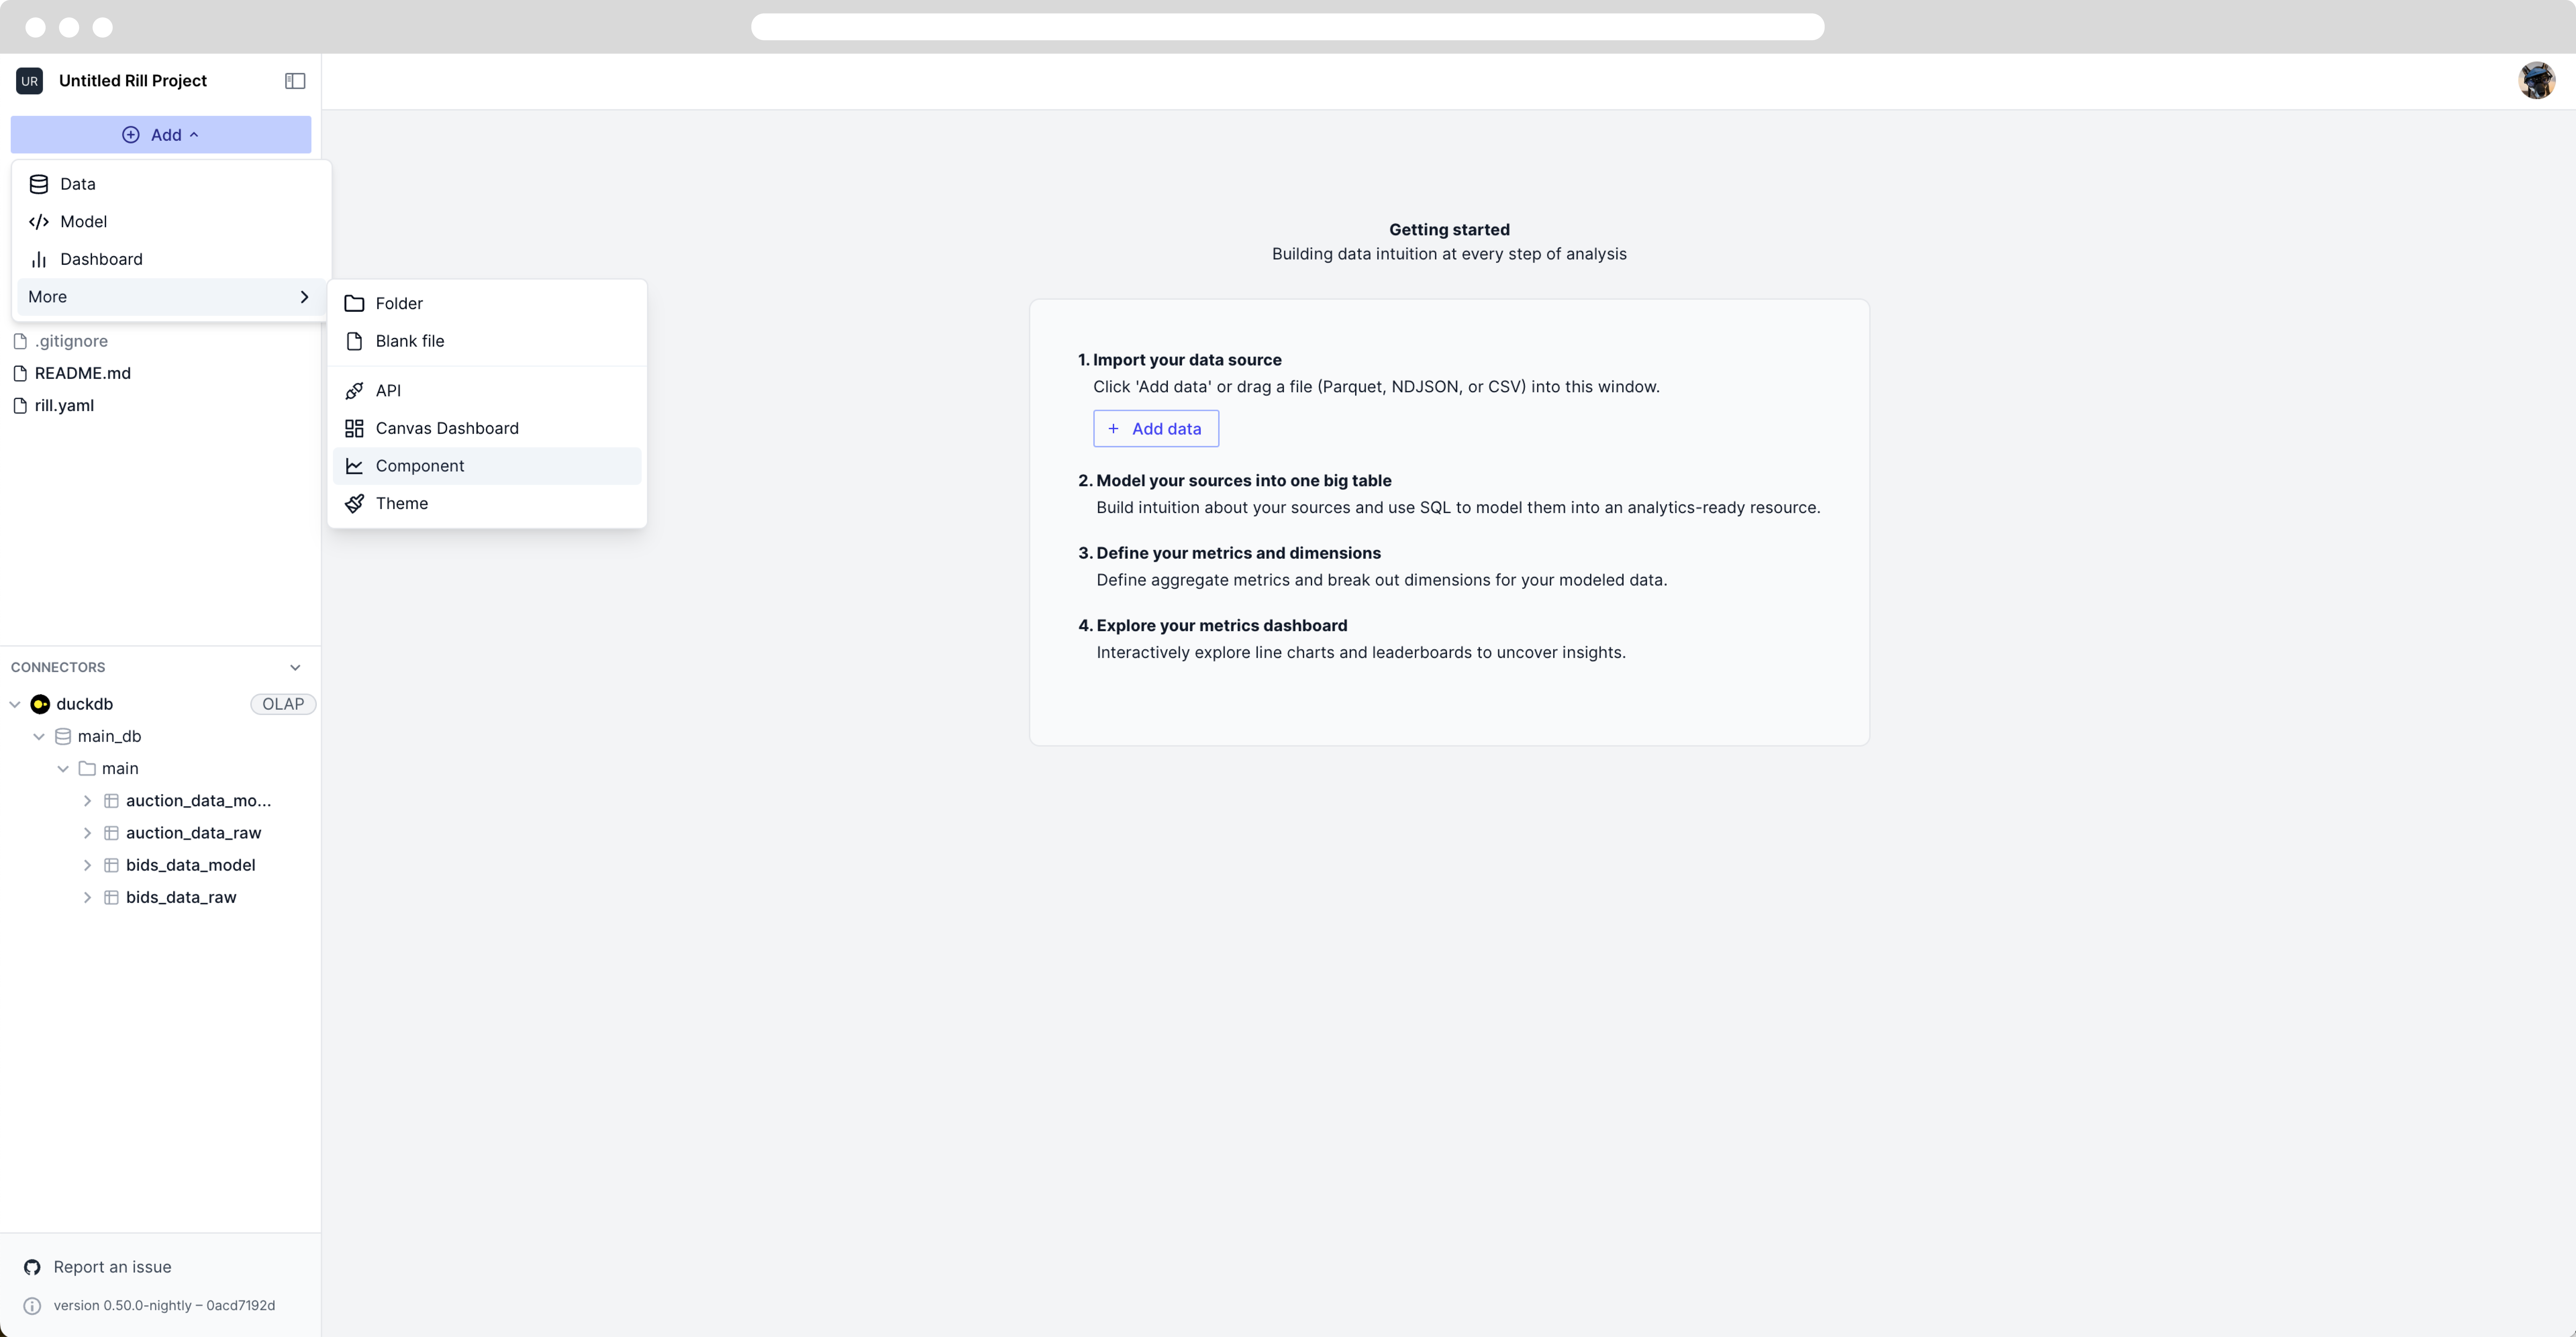
Navigate to Rill Developer, and select Component under the Add dropdown.
Preparing the Data
Before we can start asking Rill to create a visualization, we will need some data to be available on the Component. You can choose between running a raw SQL query against the available models, a metris_sql against the metrics layer or using an available API.
In this example, we will be using a metrics_sql and select the following measure and dimension:
data:
  metrics_sql: >
    select impressions, placement_type from bids
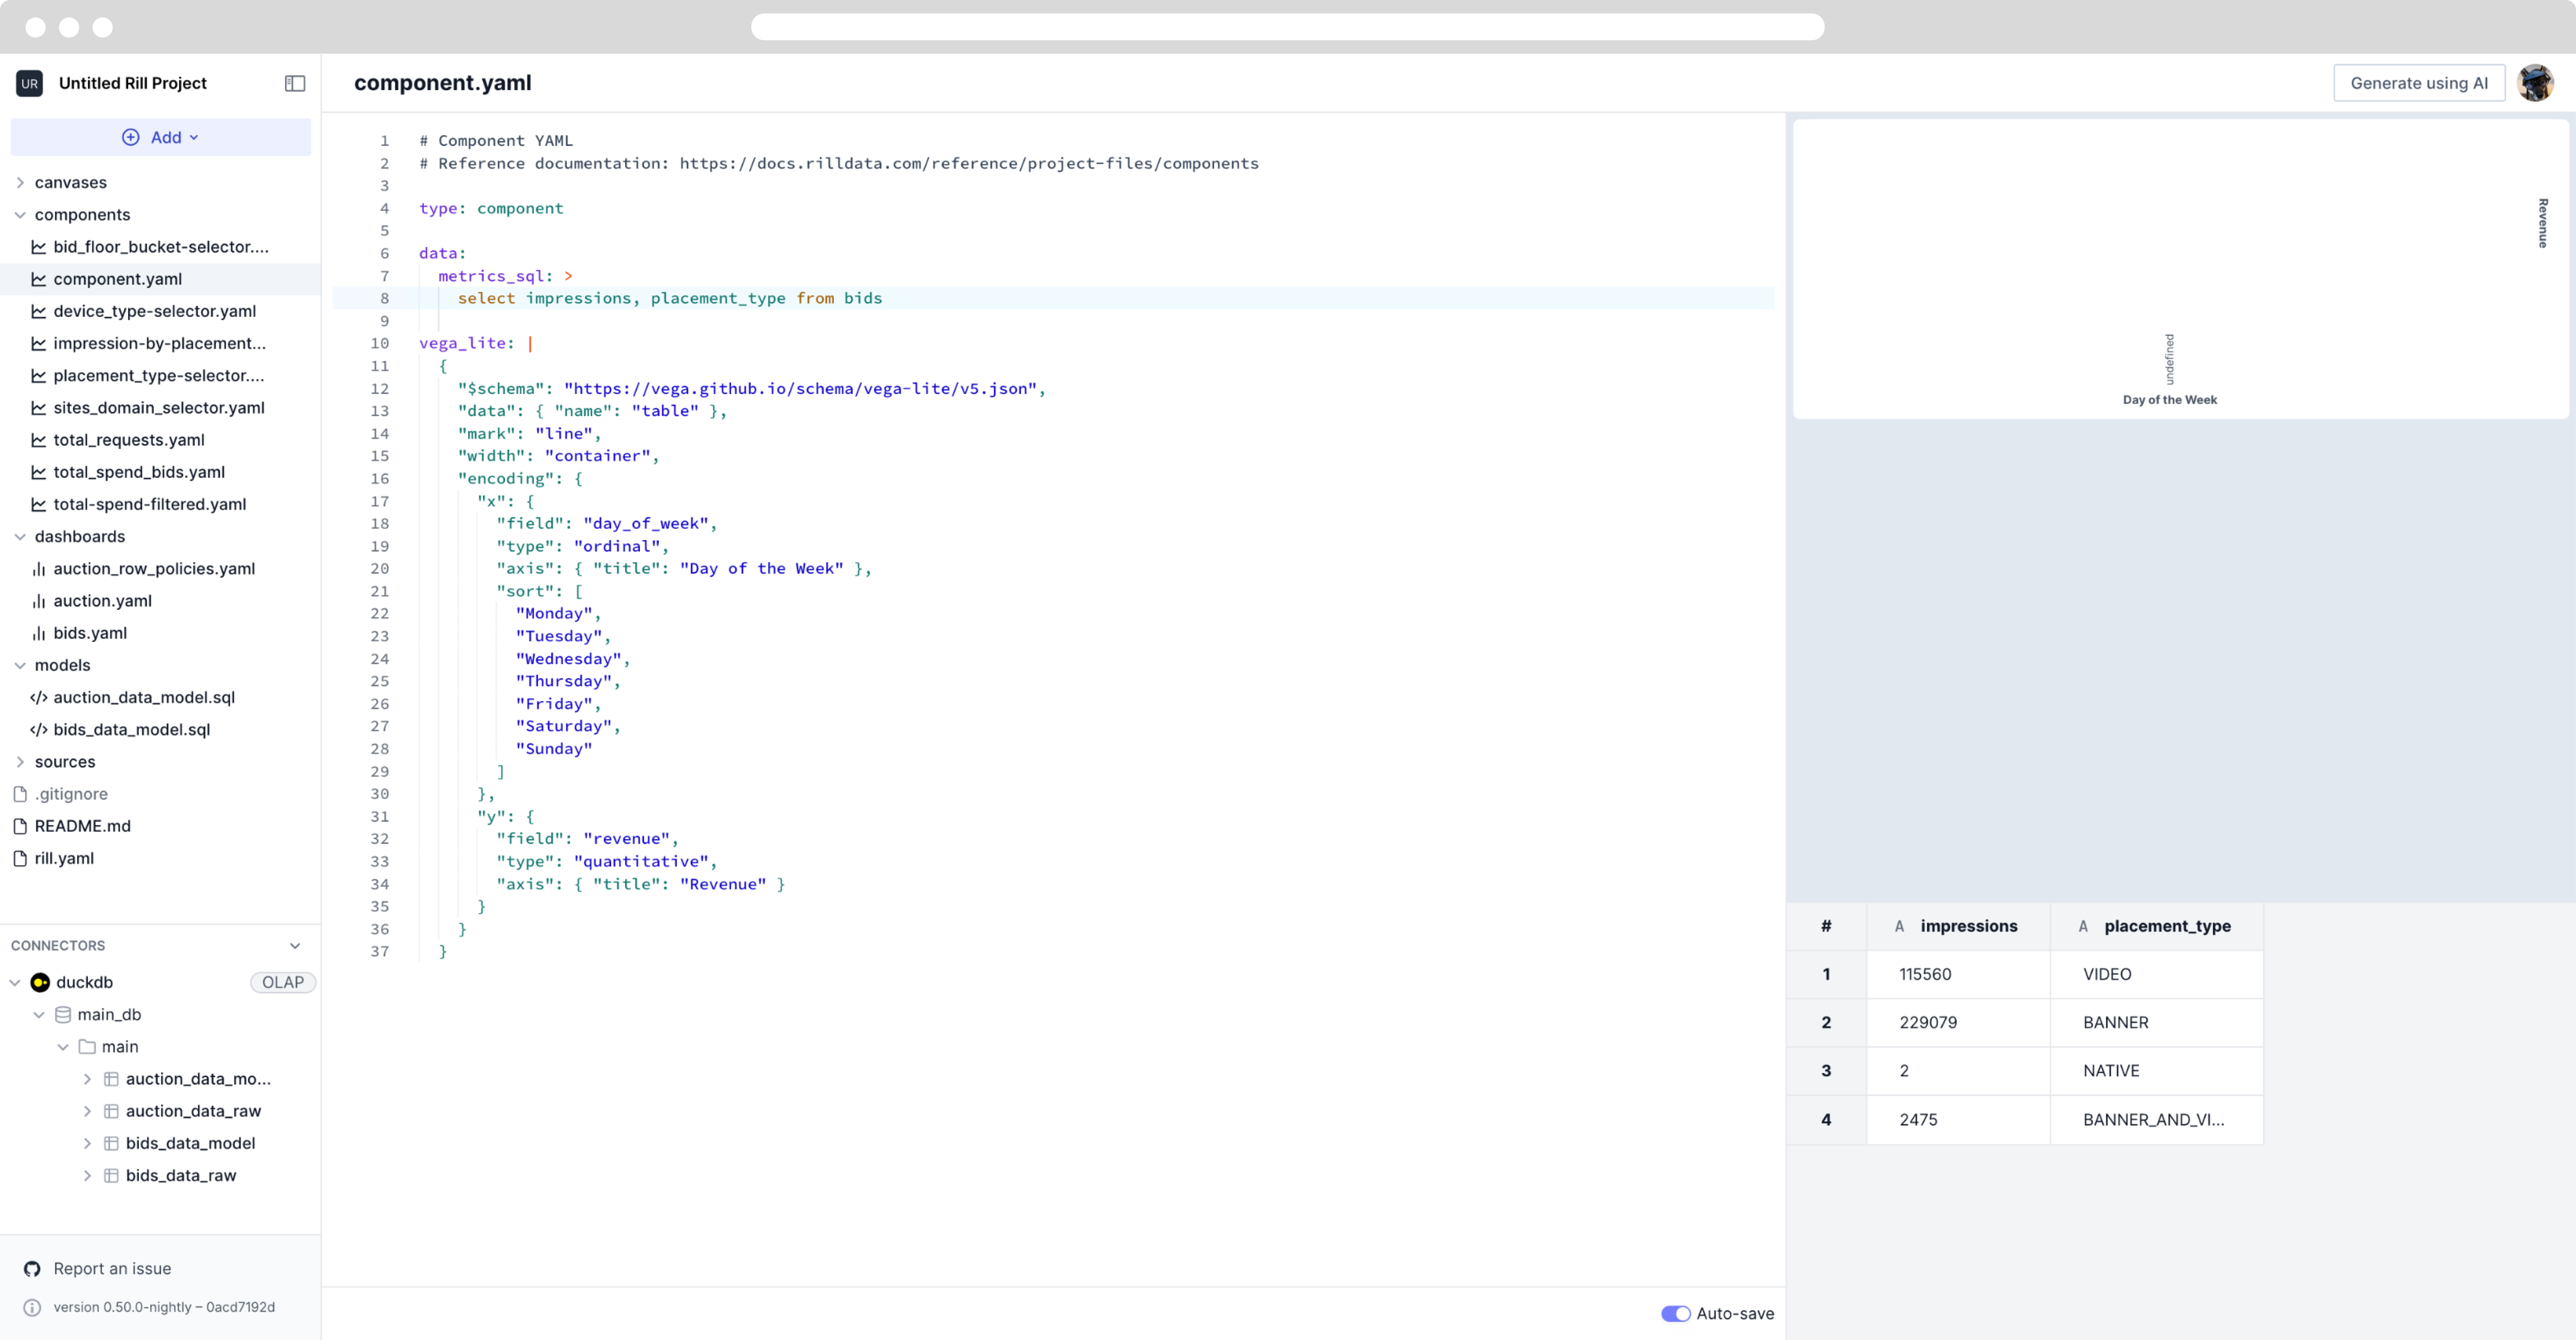
In order to call the measure and dimension by name, the name key must be defined on the dashboard level. Please refer to the dashboard, bids, for more information.
Once we see that data is available in the table below the chart, we can select the Generate using AI button and type in a prompt.
Using Natural Language
Create a bar chart
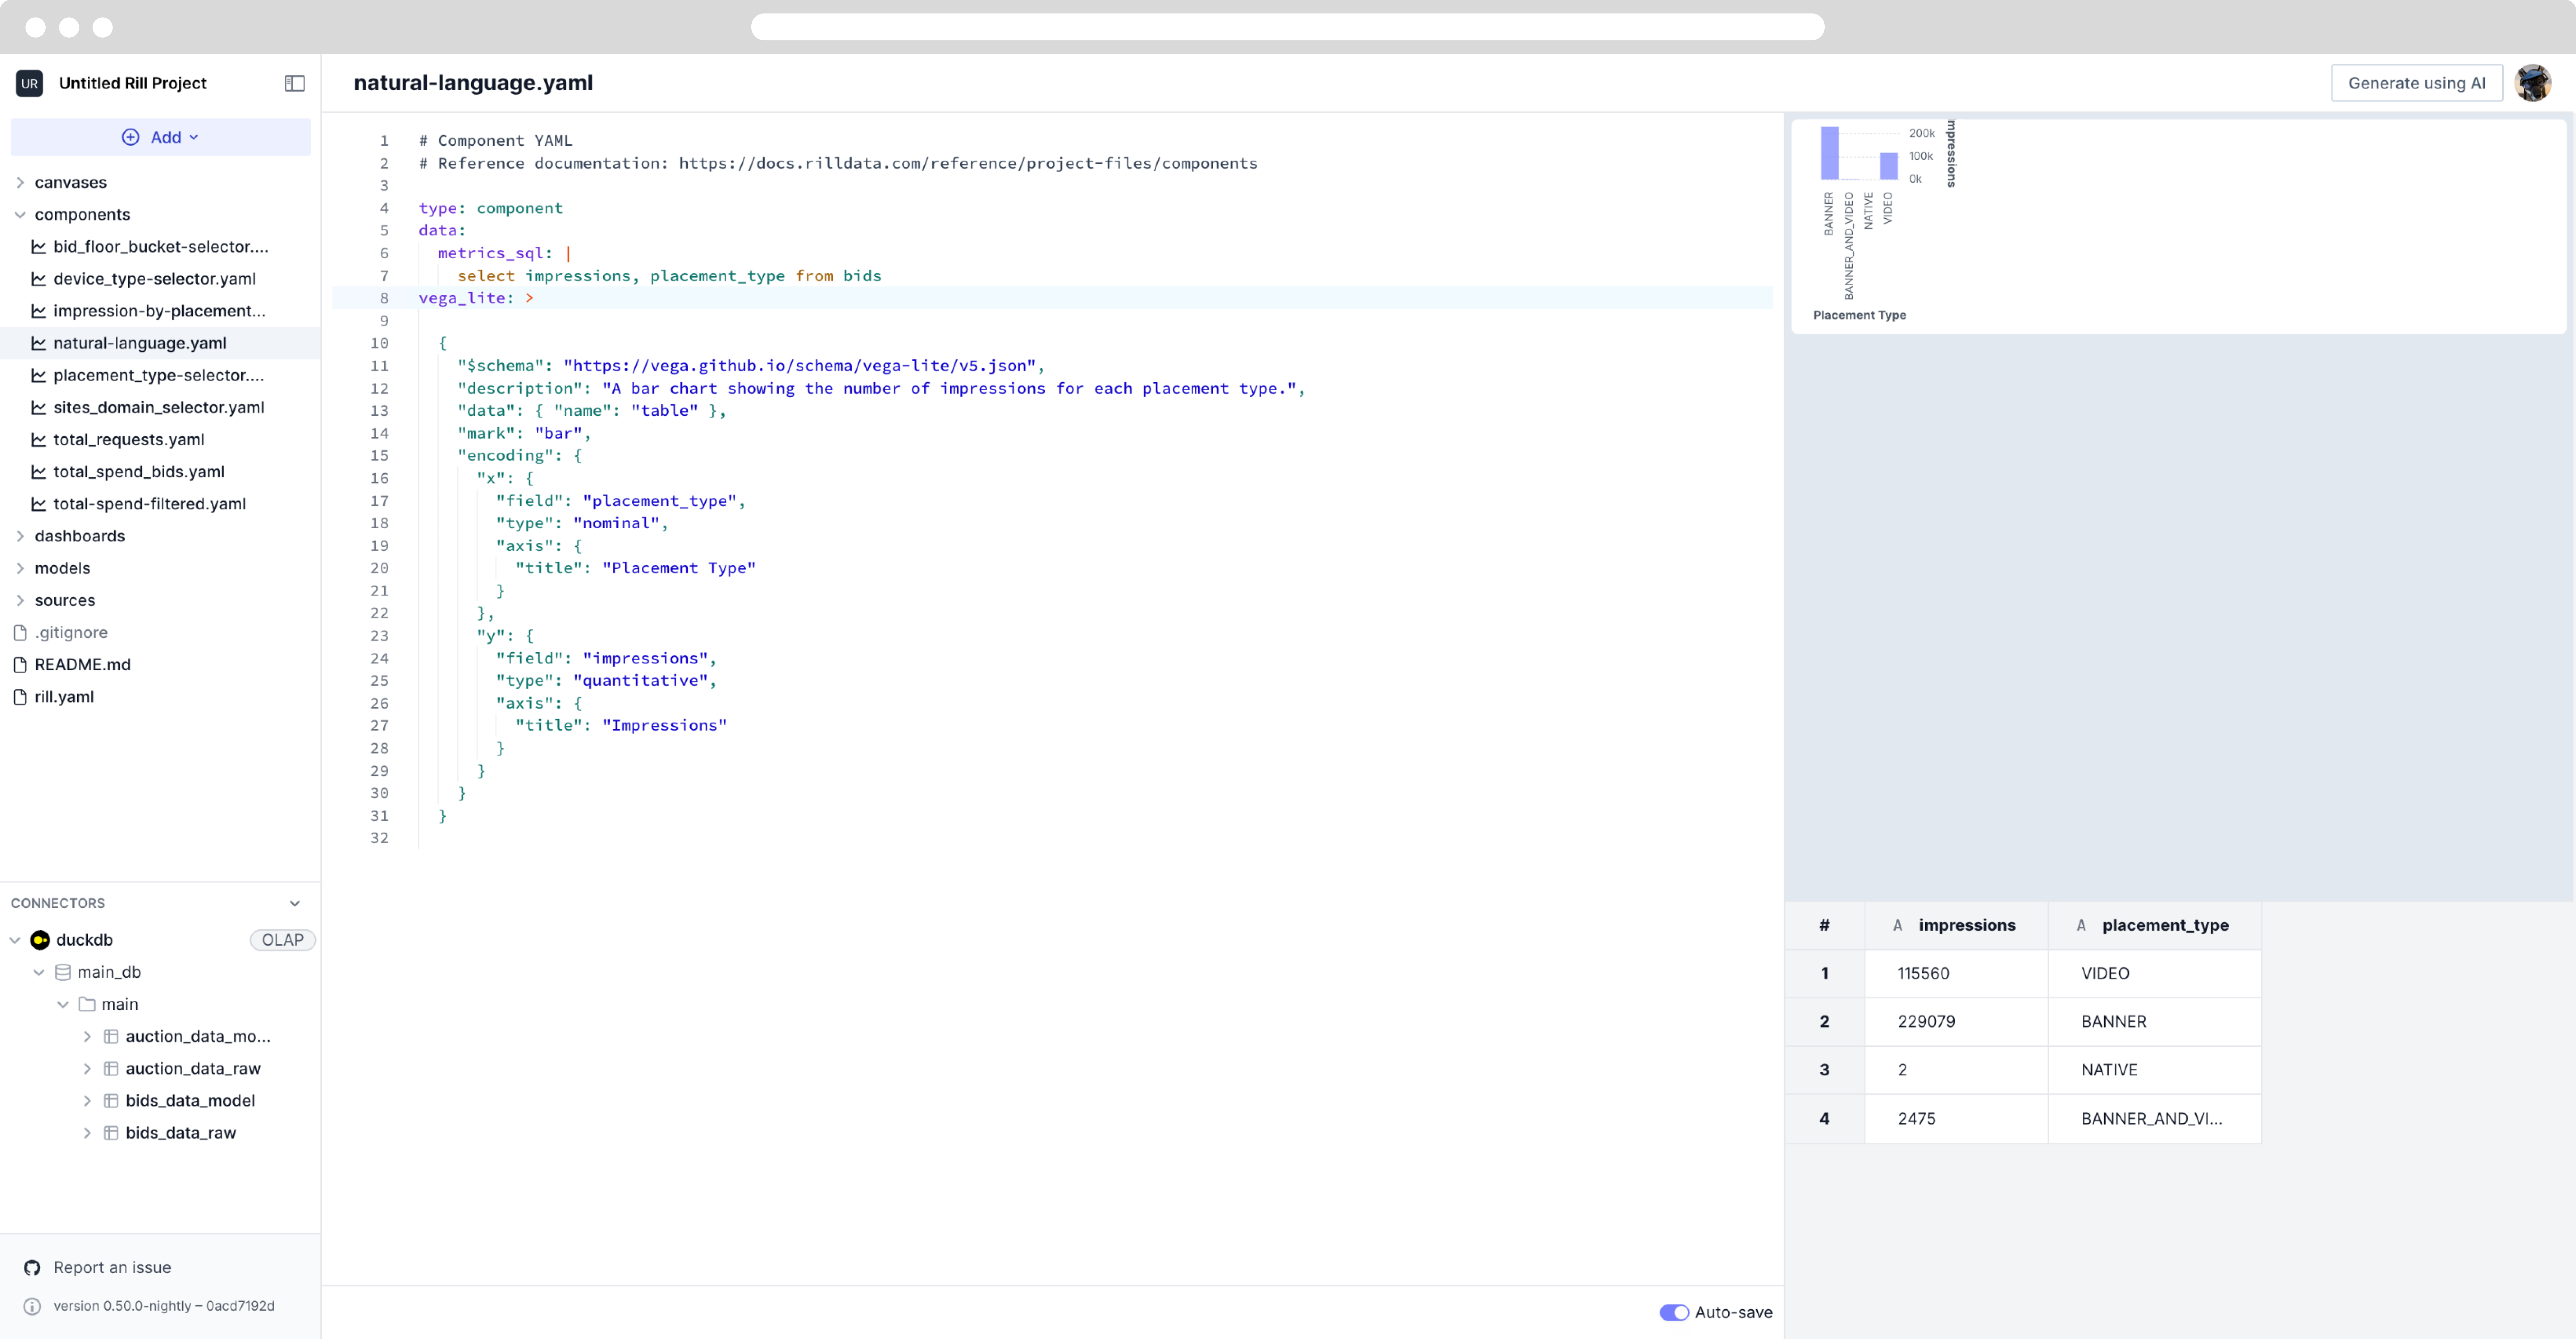
When finished, the UI will automatically update with the corresponding vega_lite spec and a simple bar chart should be displayed above the table. If you want to modify the look, or after you've changed the data, re-create the chart, you can do so. The Generate using AI UI will save your previous runs of the component and can be refreshed.
Making some modifications
For example, let's modify the metrics_sql and pull in the time-series column, __time.
  metrics_sql: |
    select impressions, placement_type, __time from bids
From here, let's provide a bit more detailed request.
create a stacked bar chart with __time over impression and color the stack by placement_type.
span the chart the whole width of the display
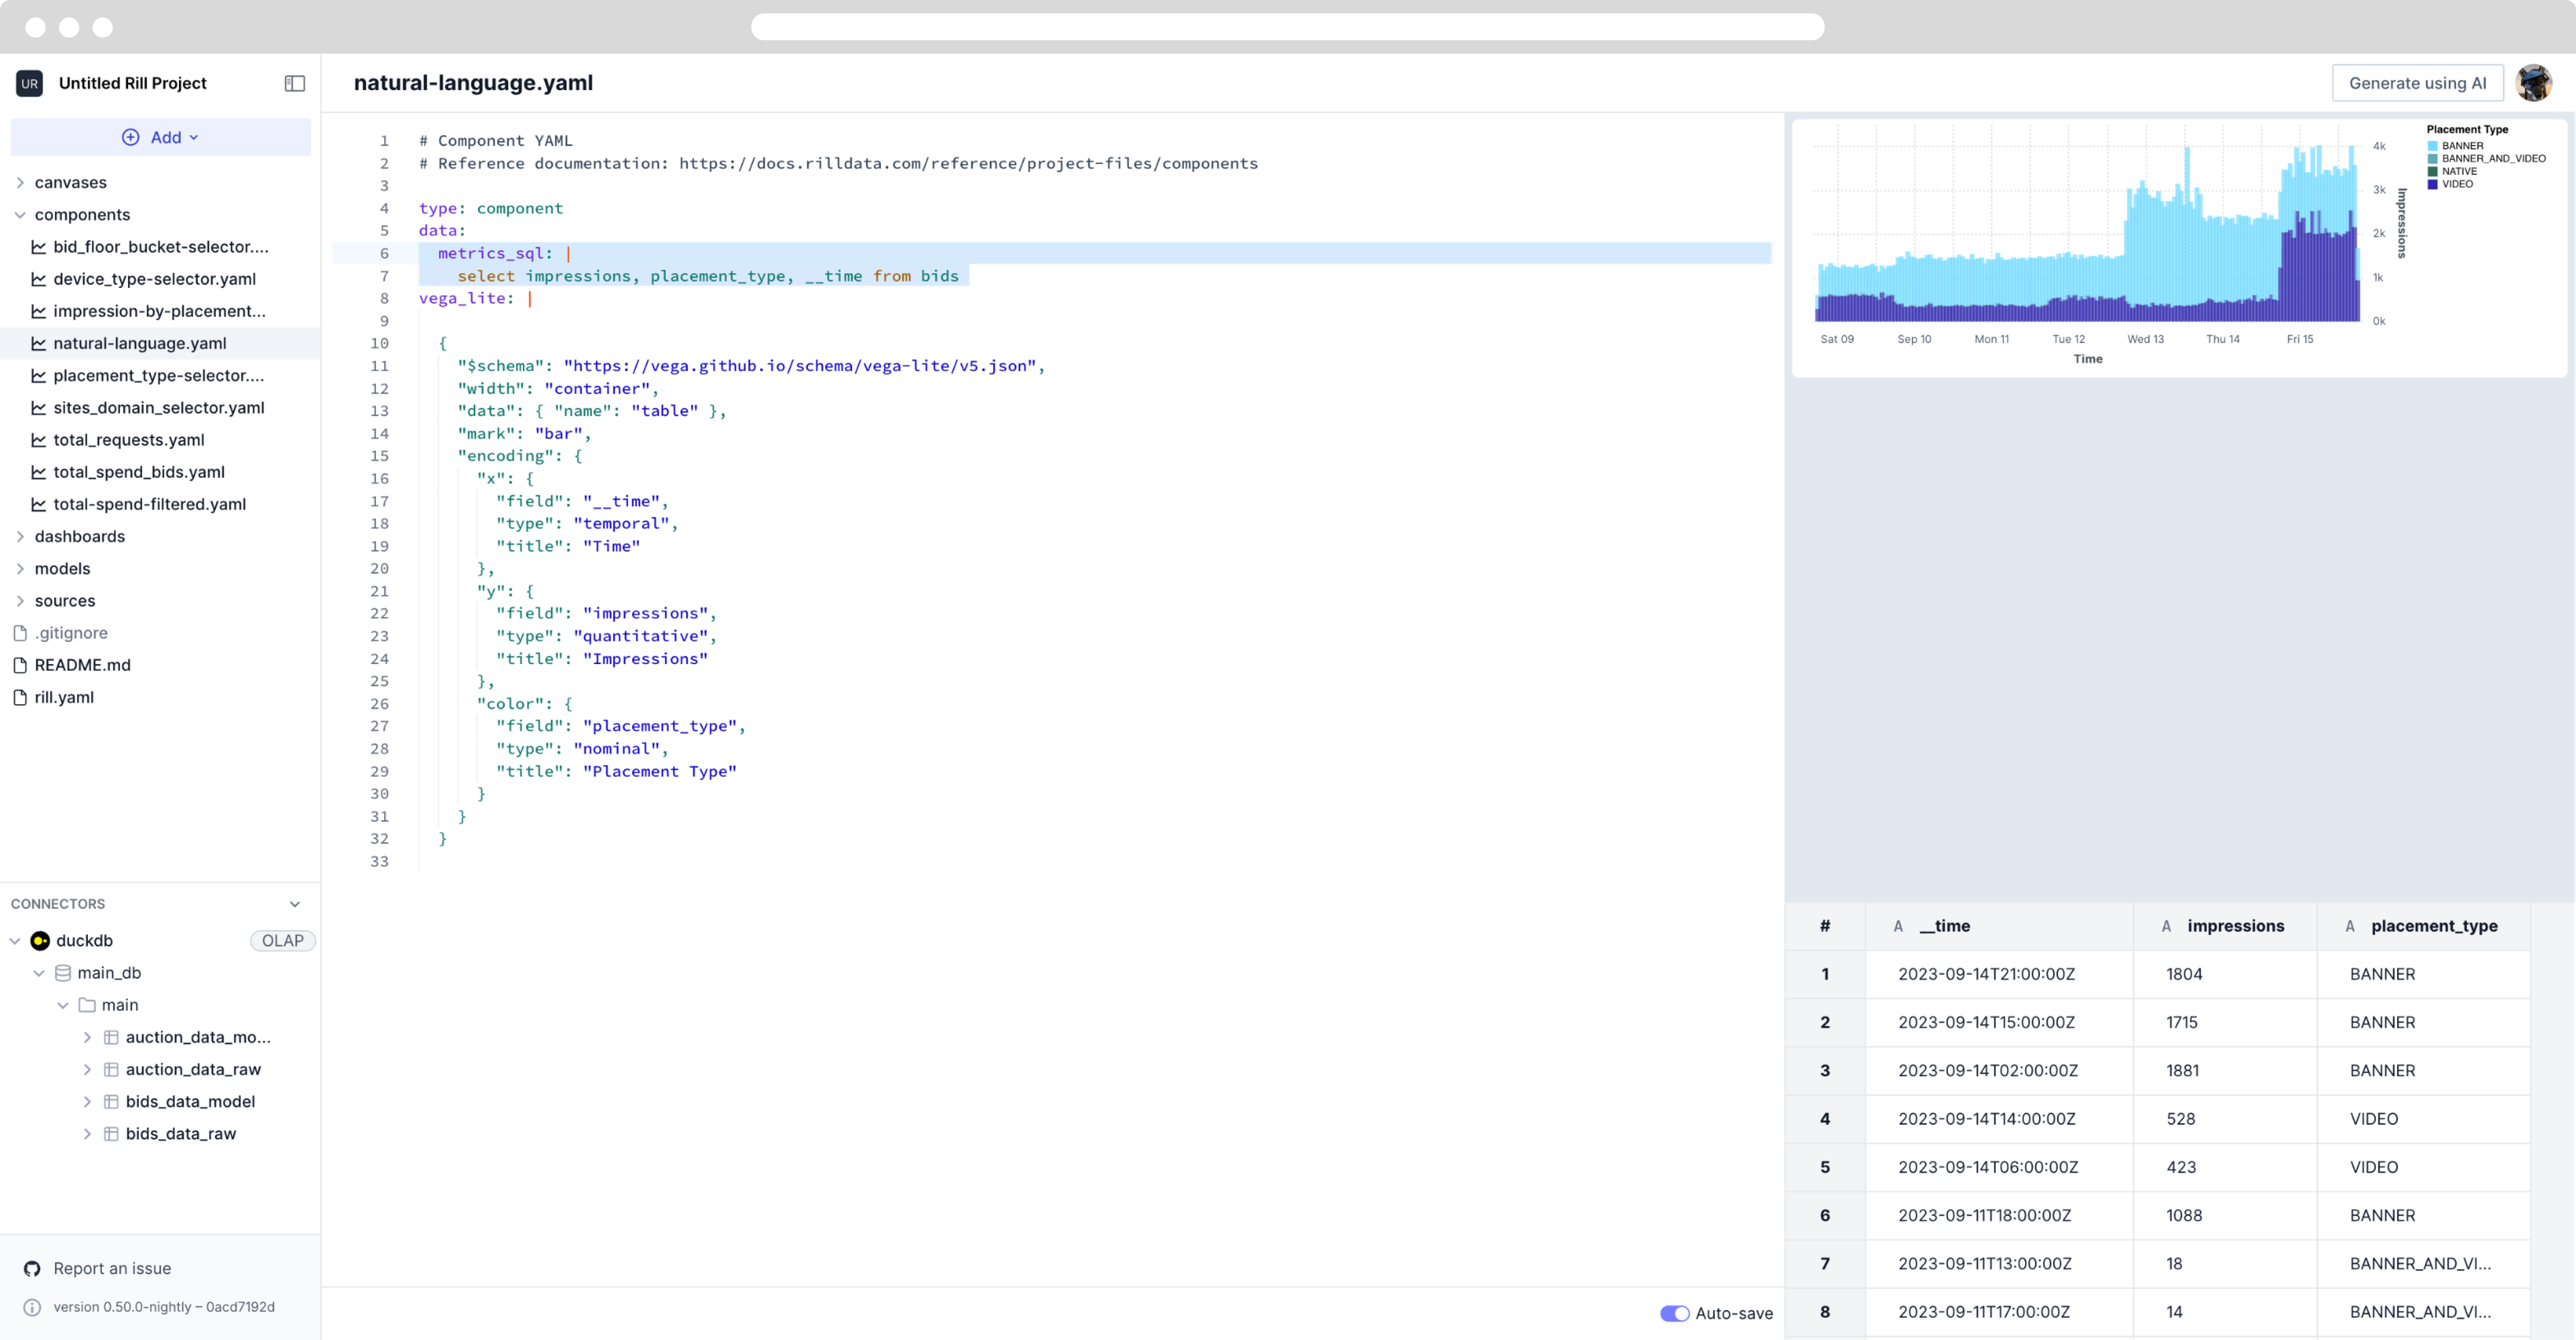
As you can see, the request sends out a more detailed vega-lite spec that fits the request and the chart looks better. In addition to this, you can have a conversation-like chat with the UI. For example, instead of modifying the whole prompt, you can say something like,
Actually I want this to be a line chart.
and the chart will update with all the same components but as a line chart.
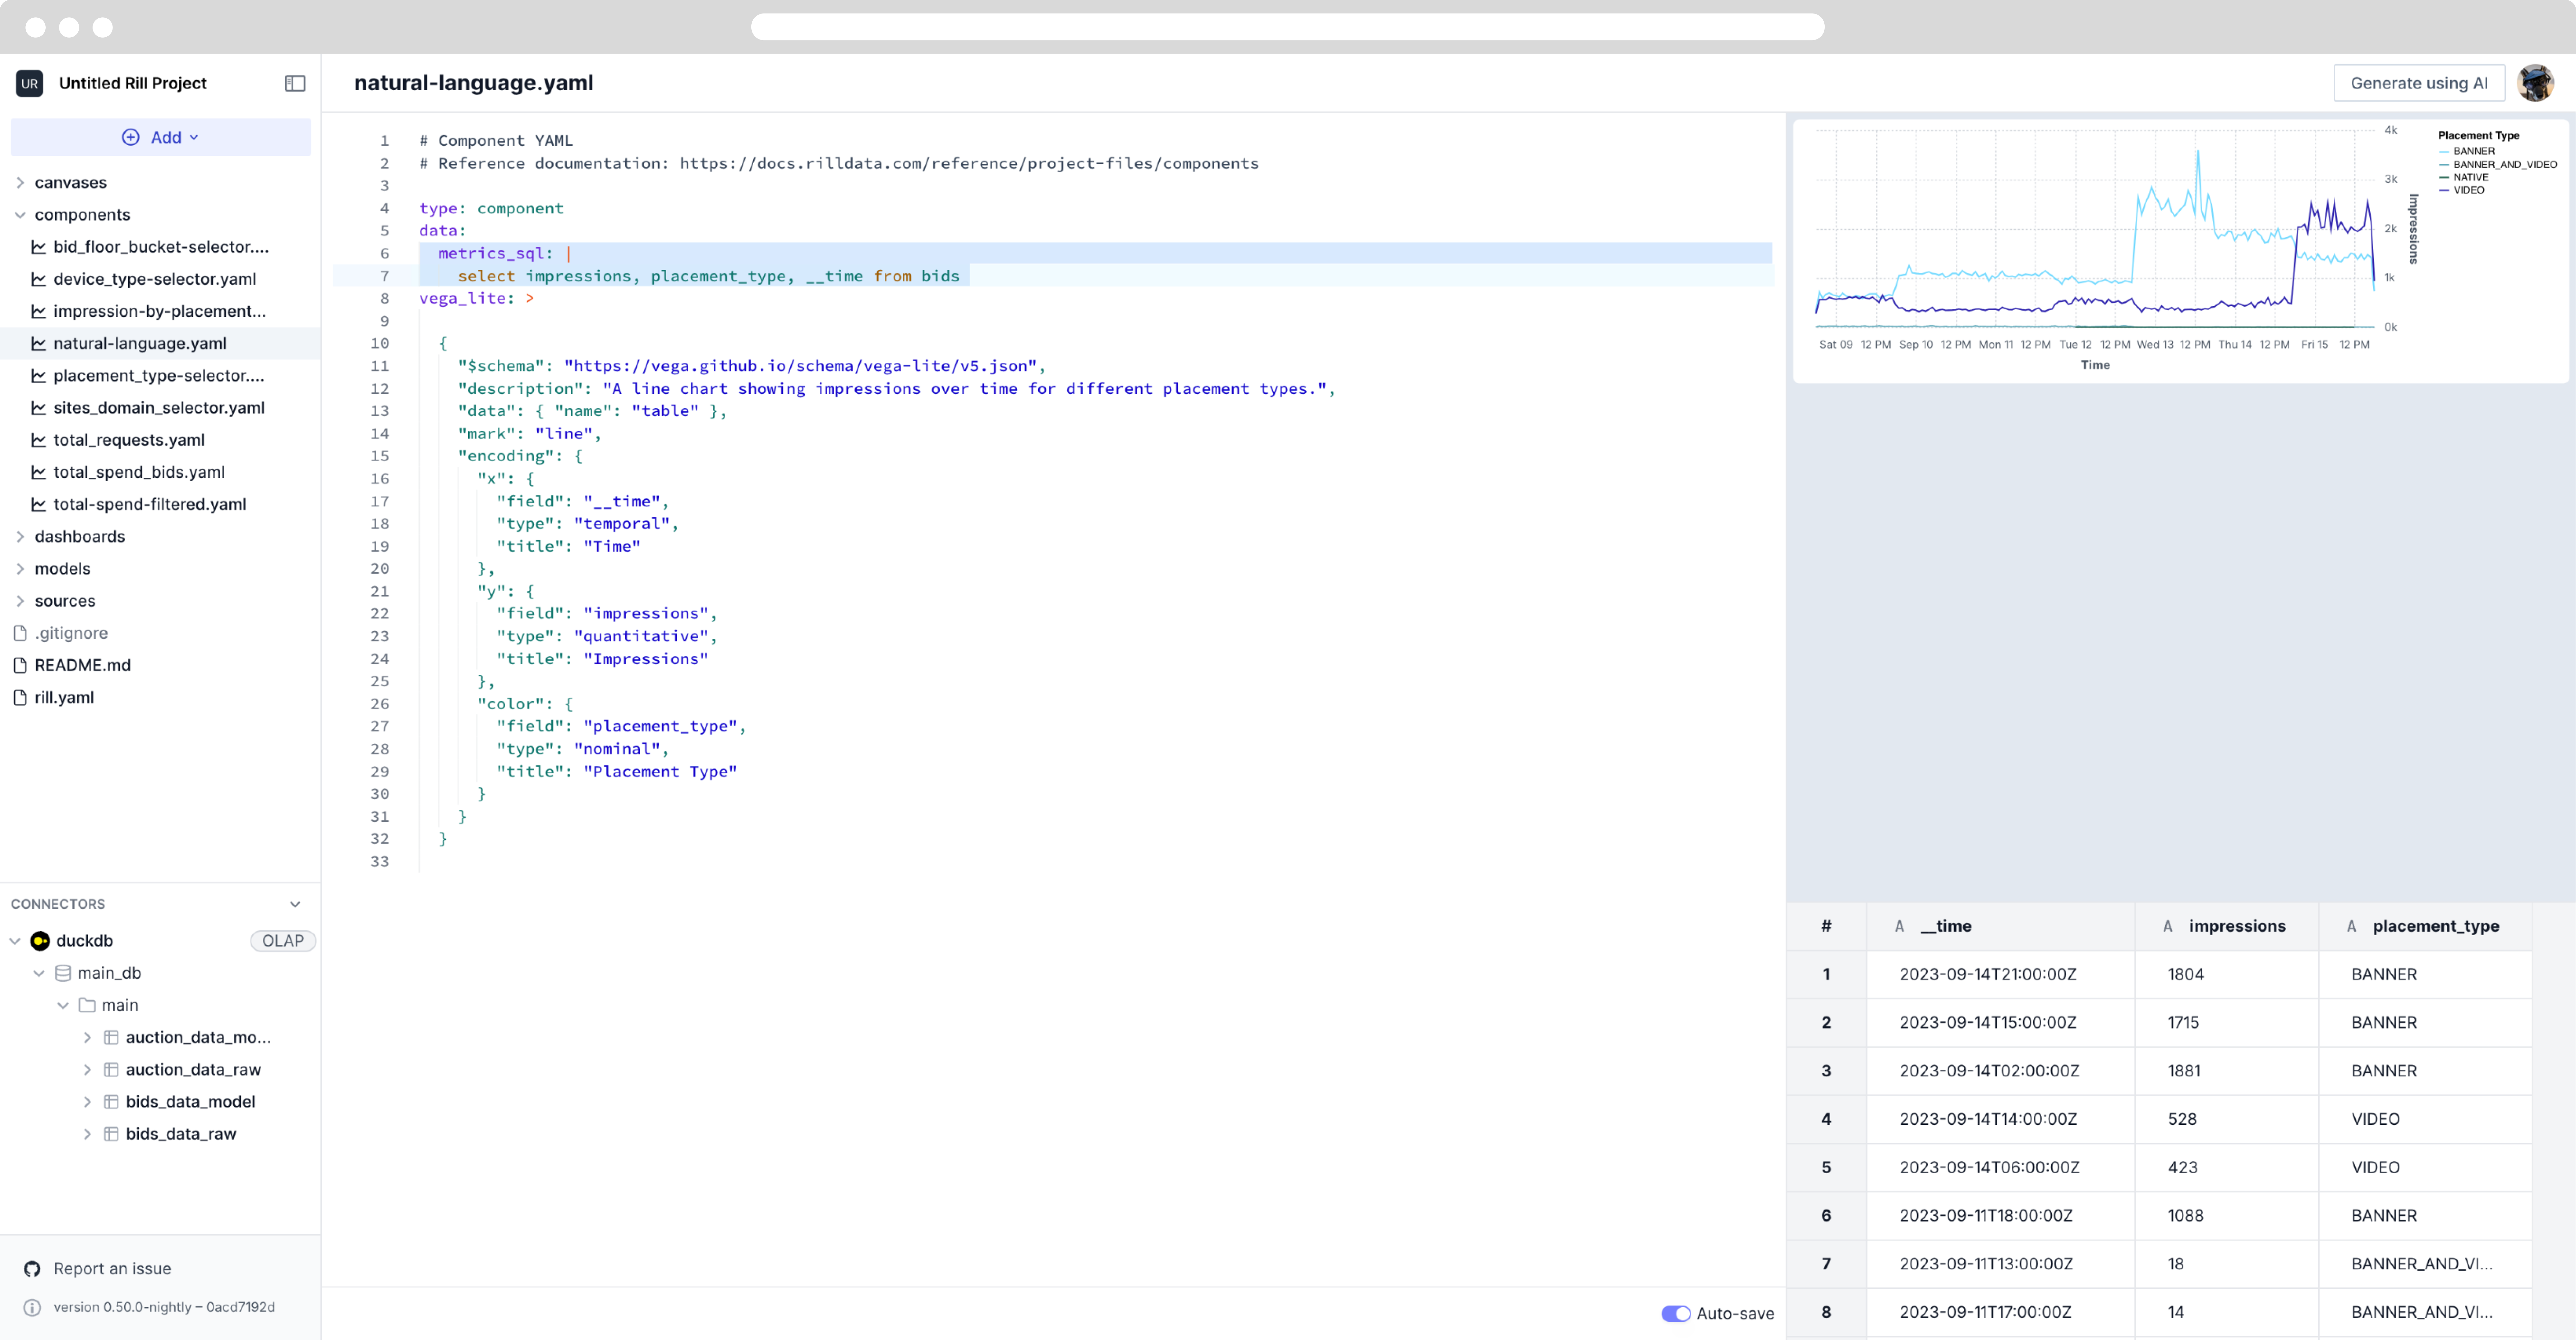
As the graphs are creating a vega-lite spec, you can create many different types of graphs for your needs. For a full example, please refer to Vega-lite's example page, and explore our GitHub repositories for more examples.