How to create a map Component in Rill for Canvas Dashboards
We will assume that you've already gotten started on build canvas dashboards and are interested in creating a map component. If not, please refer to the canvas dashboard section.
Import the source into Rill
If you have your data source already available, go ahead and add it now. If not, you can use the sample dataset hosted here:
https://cdn.rilldata.com/examples/superstore.csv
We'll use the above dataset for this guide.
Create the Model / Dashboard
In our case, our data is already prepared, but if not, you can create a model from the superstore table. Next, you can create a dashboard from the model/source. Take note of the final name of the dashboard as you will need this when you are selecting the data via metrics_sql.
Creating the dashboard with AI will not add the name: key to the dimensions, so you will have to add this to the state dimension.
  - label: State
    column: State
    name: state
Create the Map Component
From the UI, select +Add -> Component.
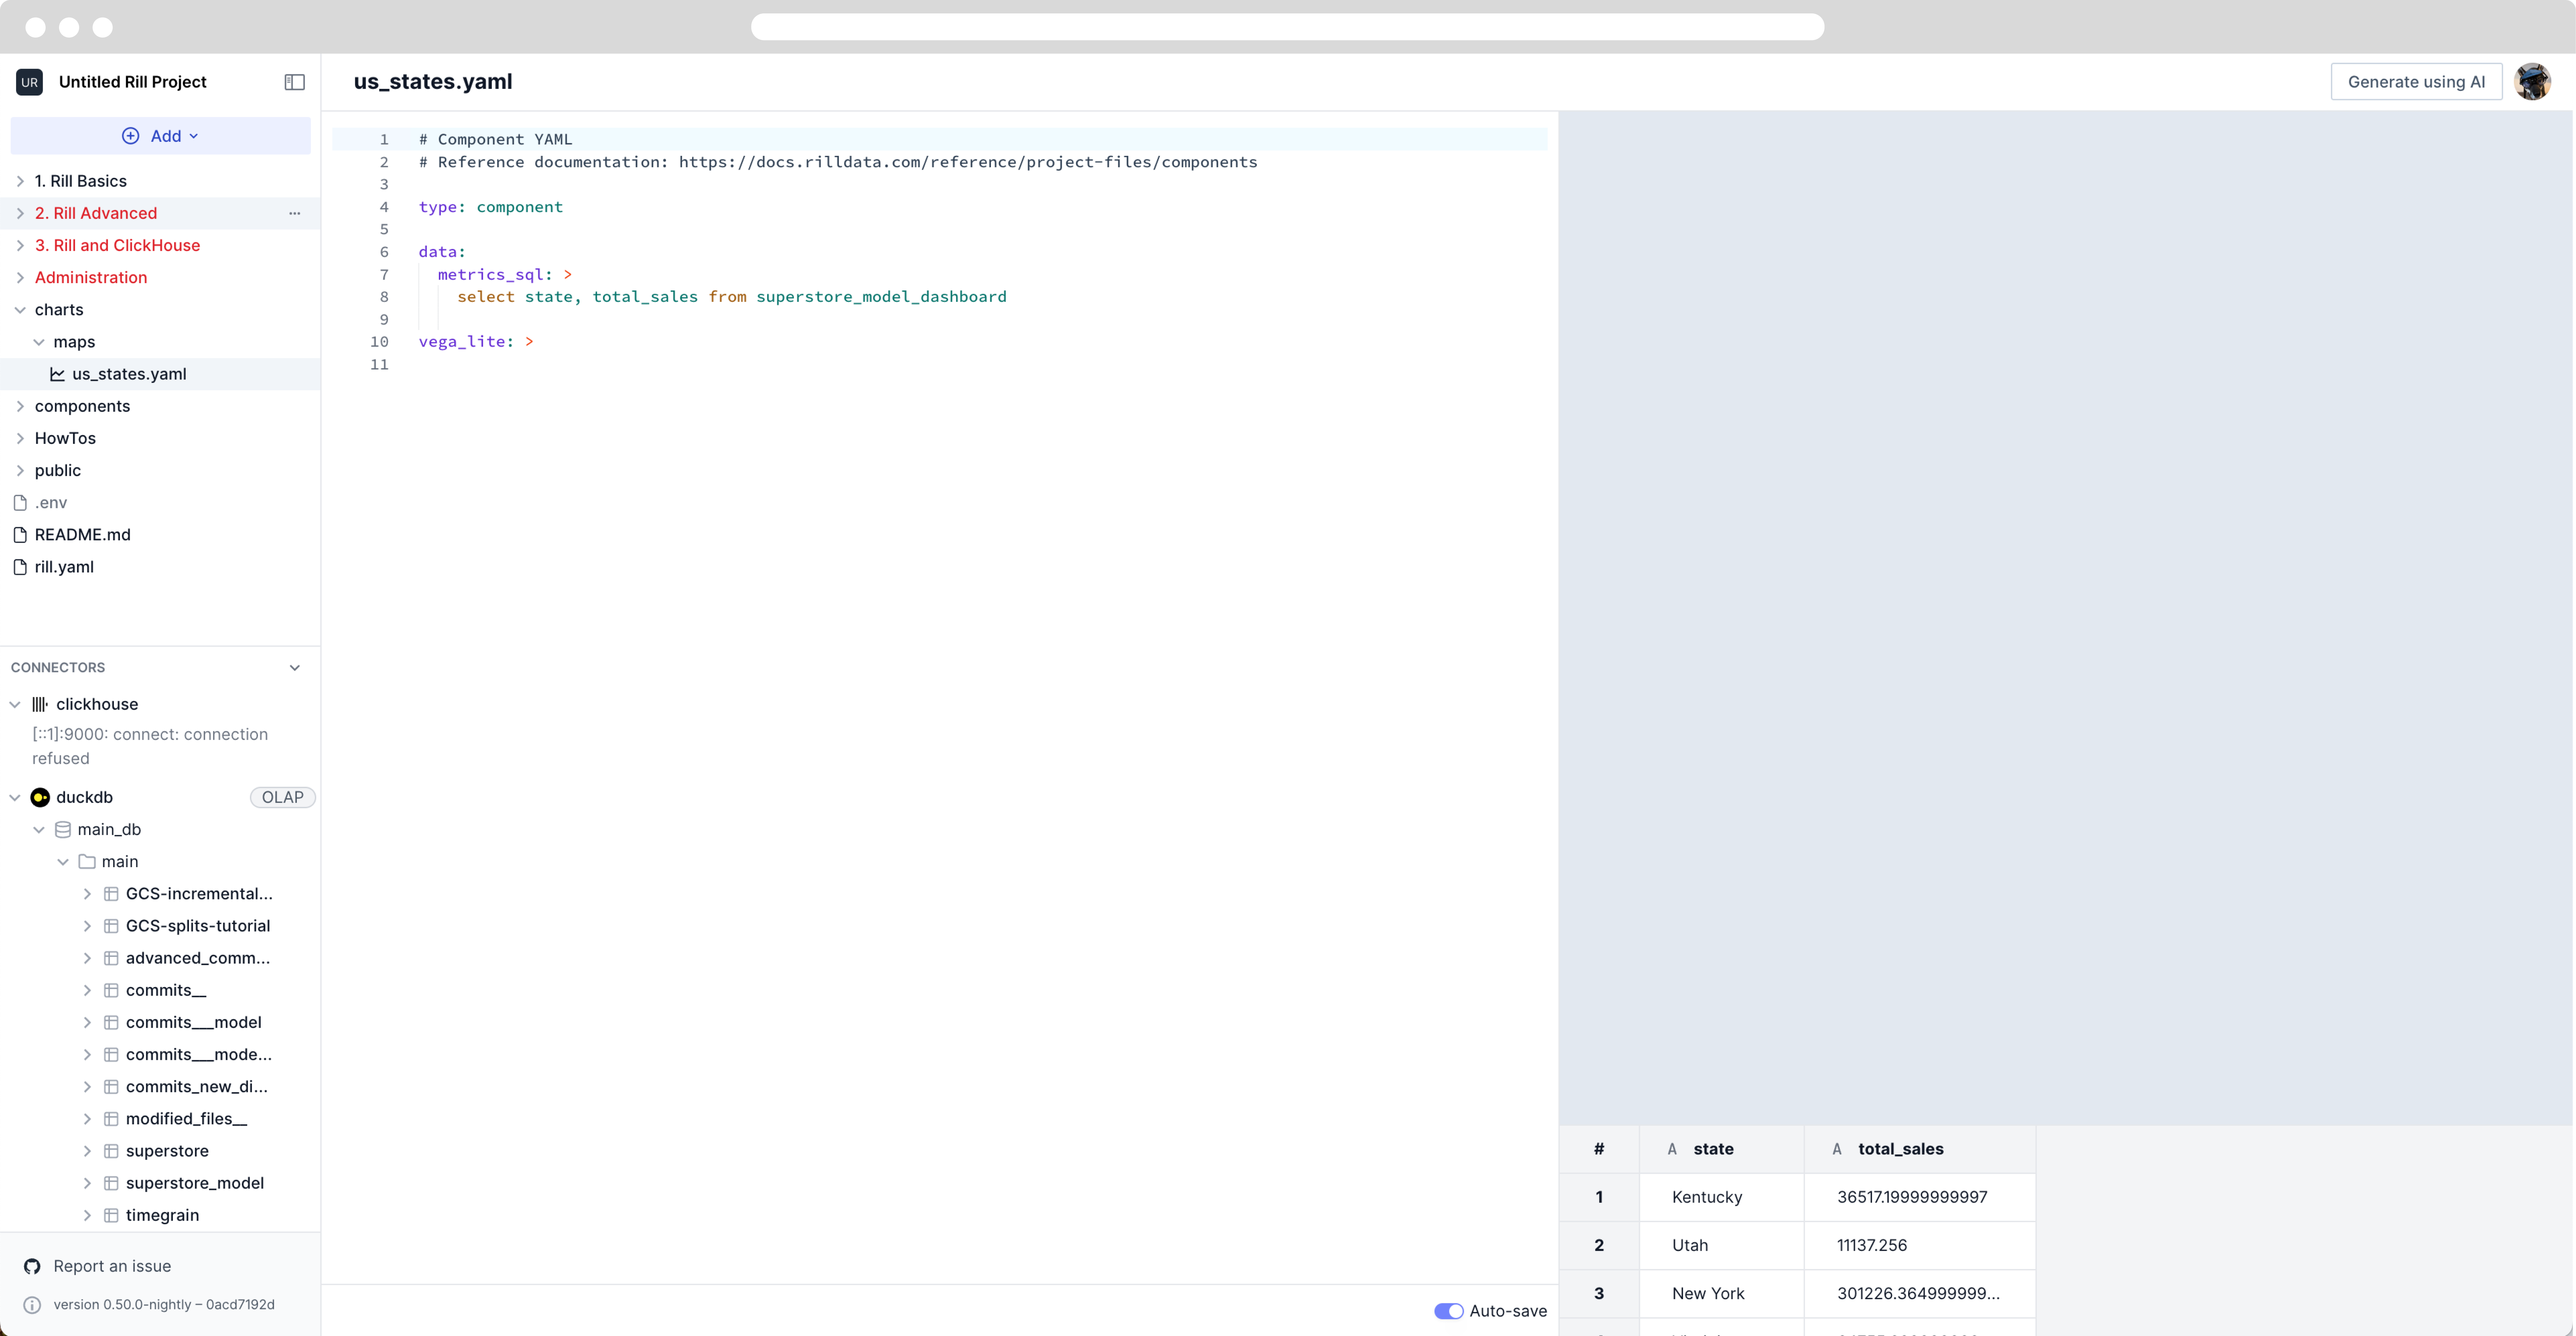
This will open the default component sample graph. Delete all the information under type:component.
First, let's create the data: key. We'll use the metrics_sql and select one measure and one dimension for the generated dashboard.
data:
  metrics_sql: >
    select state, total_sales from superstore_model_dashboard #this is the name of your dashboard.yaml


vega_lite: >
You should see a table appear with the data from the SQL query.

Using Generate using AI feature
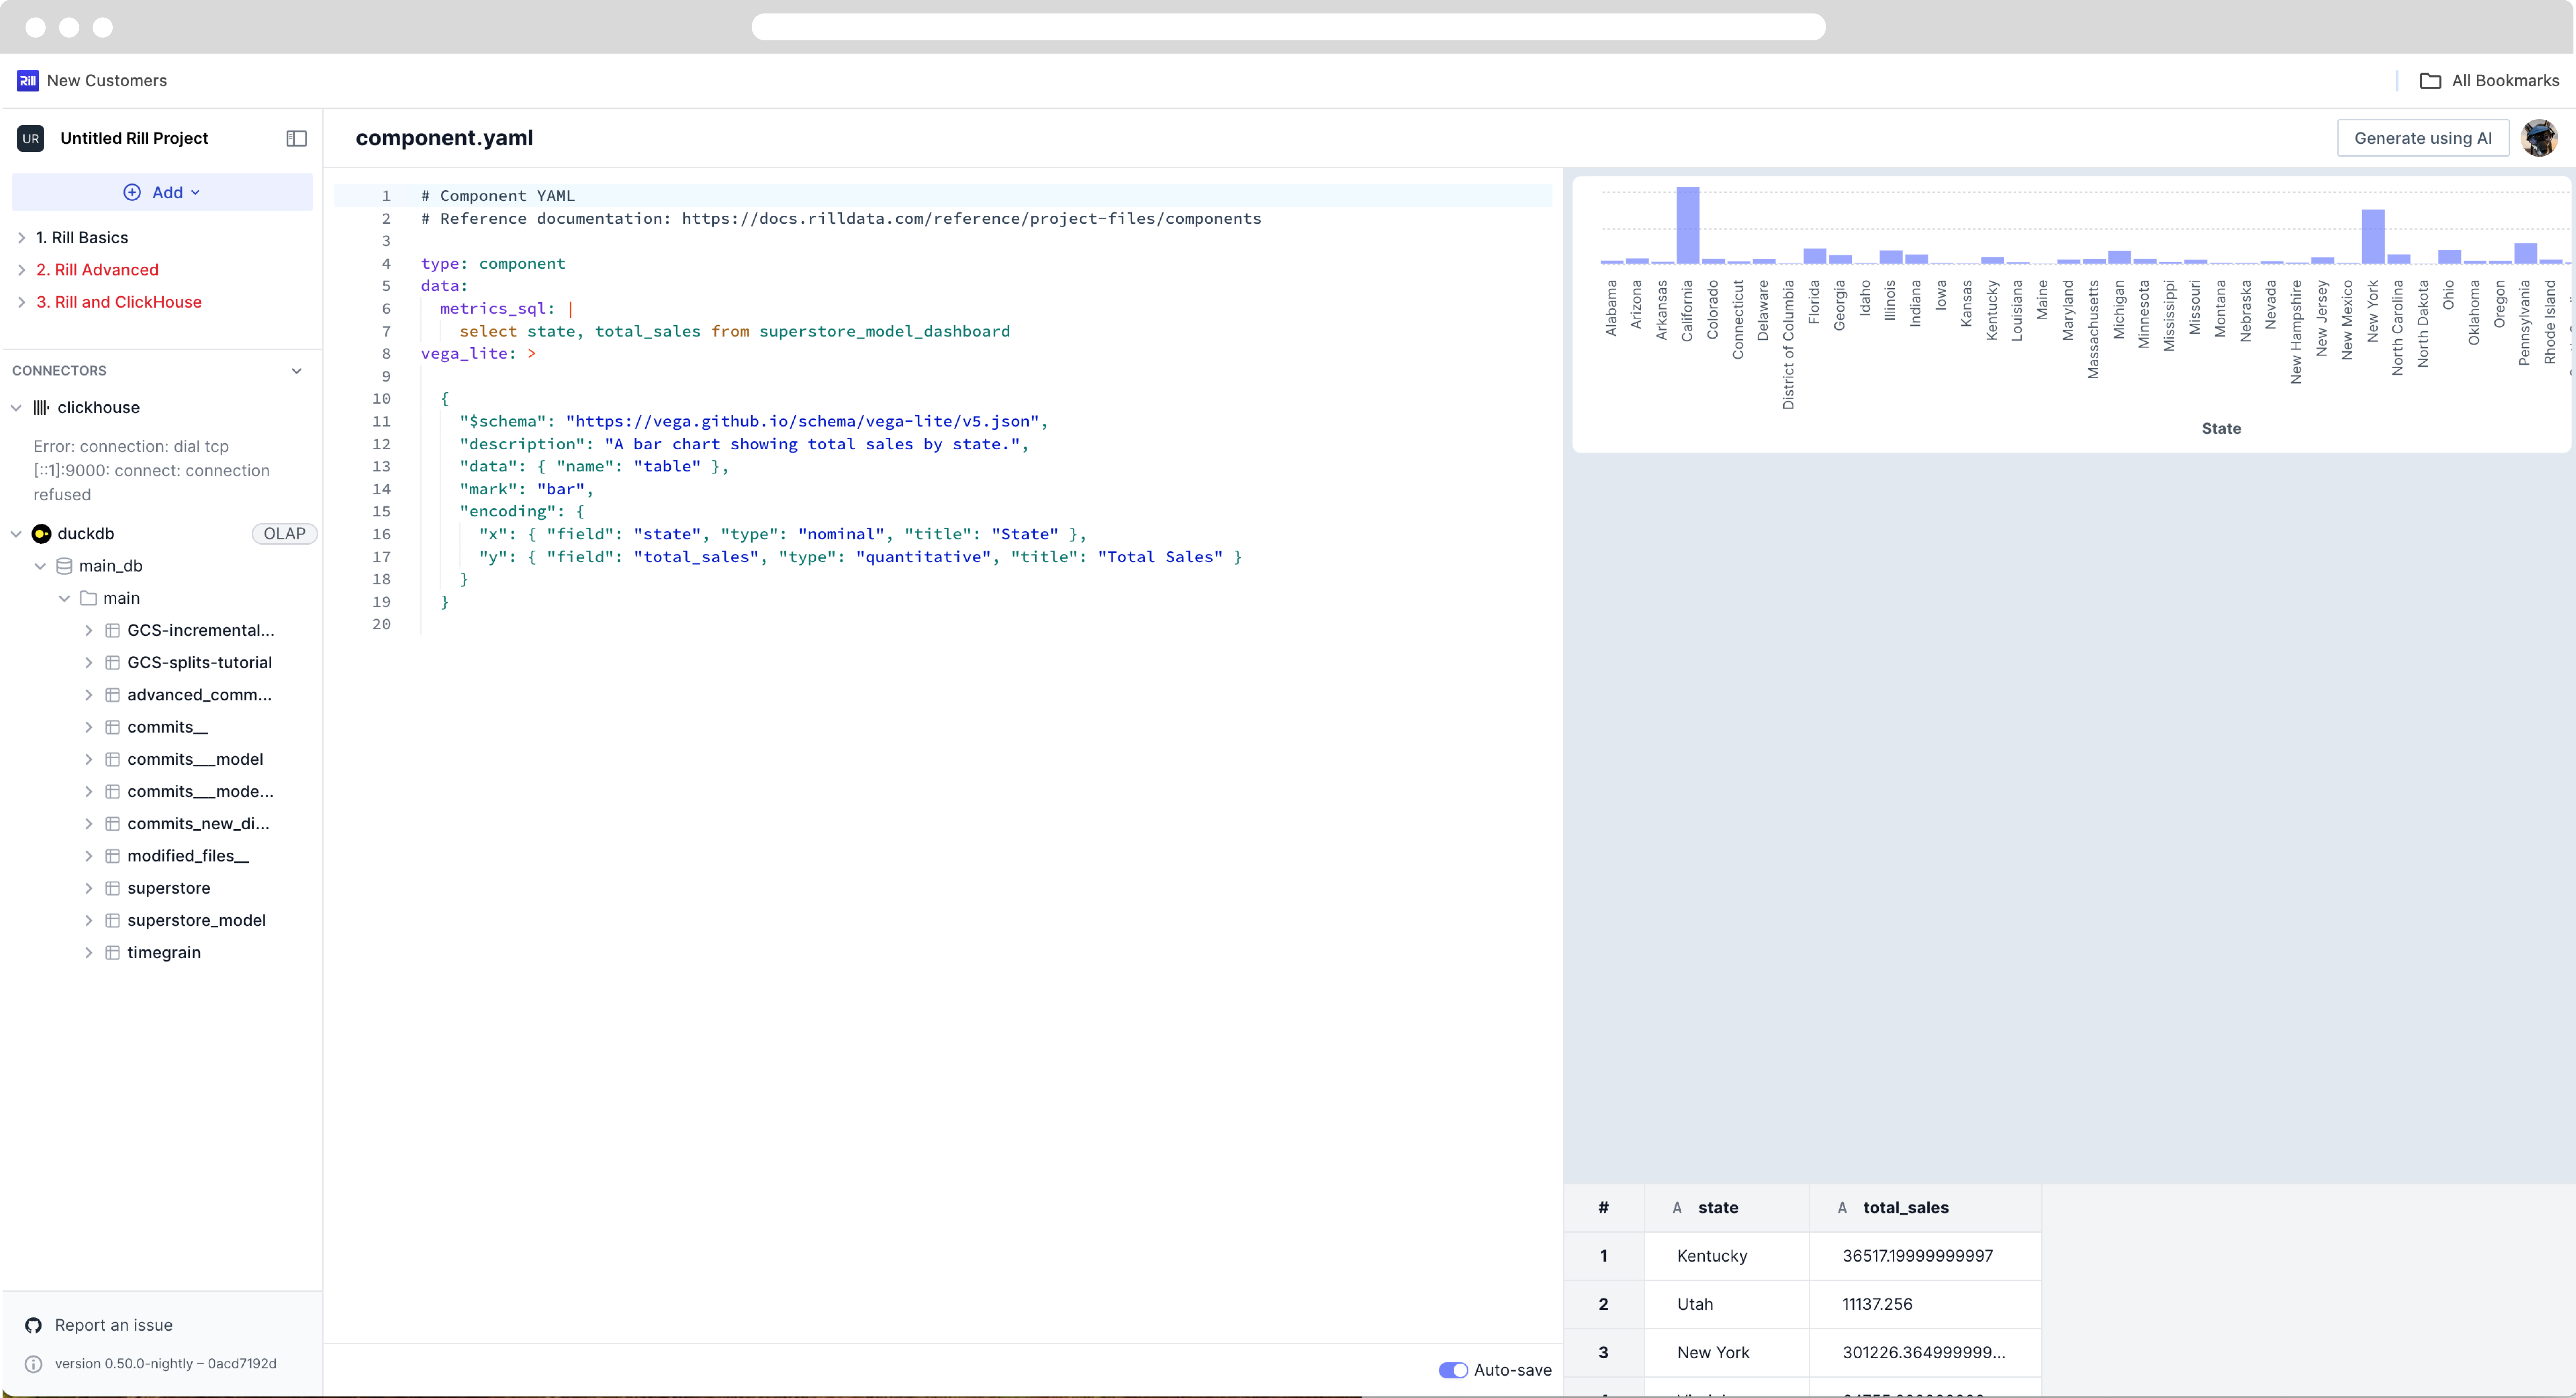
Select Generate using AI and fill in the prompt as shown below. IN order to ensure that our data is what we expect, let's create a simple bar chart first.
Make me a bar chart using the states and total_sales column data.
As we can see from the image below, the results automatically overwrites the vega_lite section and creates a spec that displays a bar_chart.

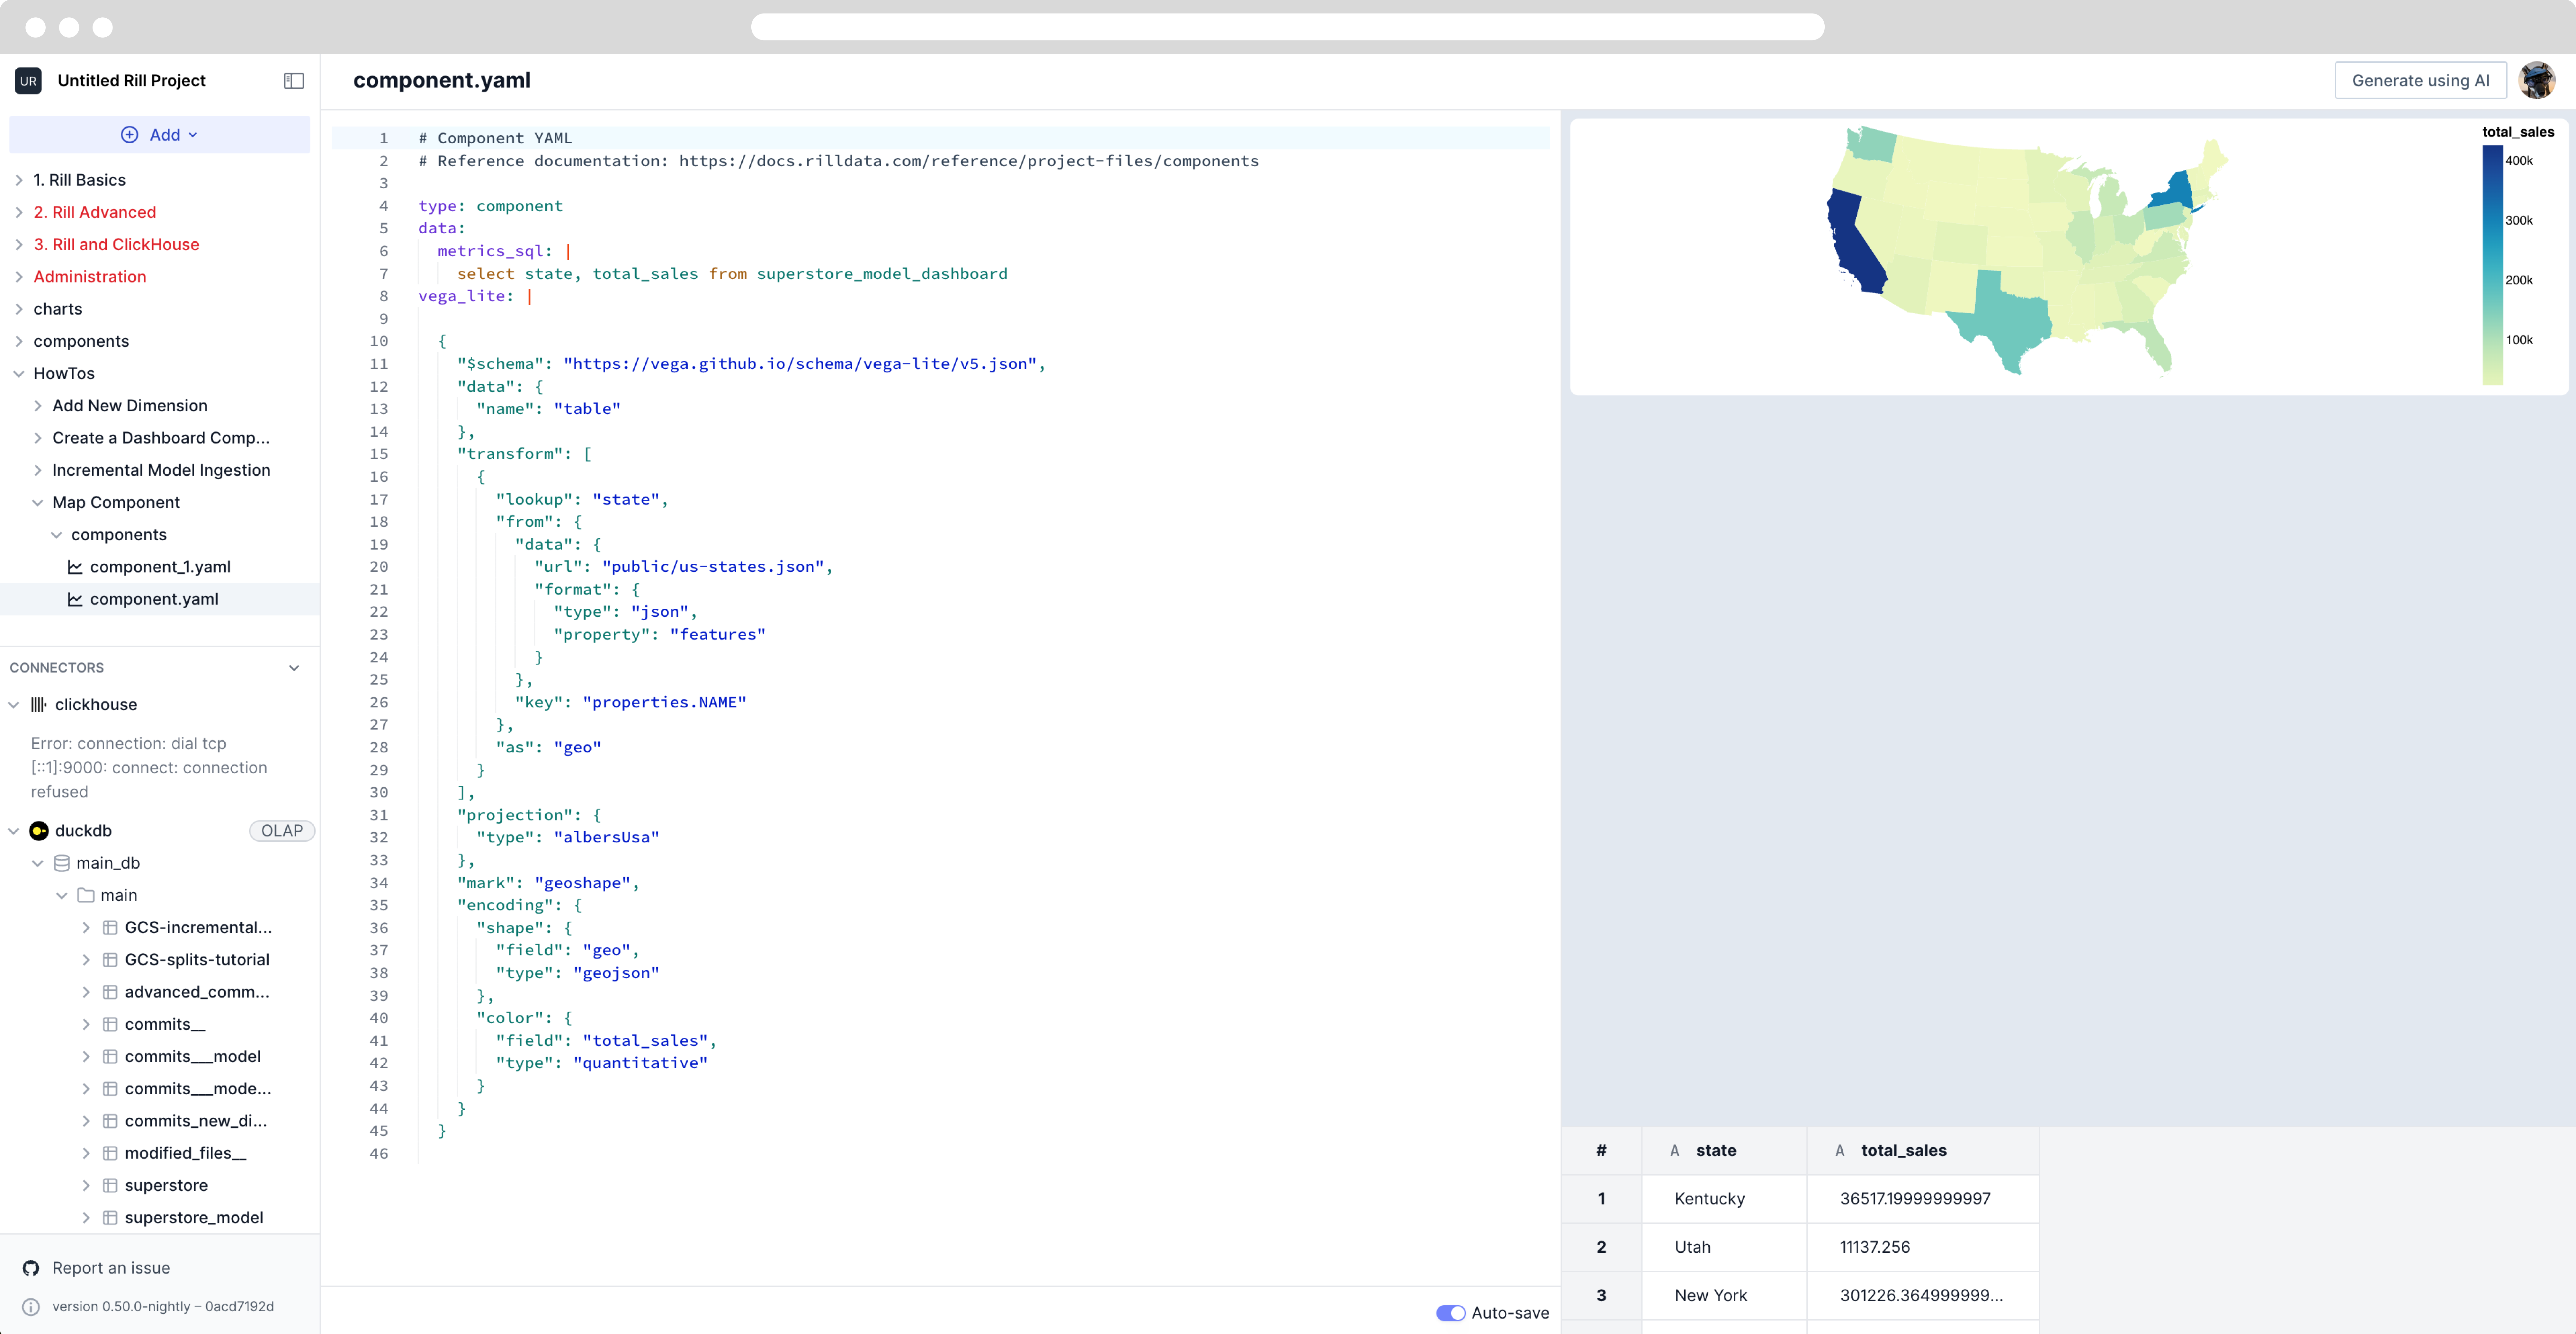
Once confirmed, we want to use the AI feature again to generate a map based on the total_sales per state and visualize this is as a USA map. In order to do so, you will need to download the public geoJSON file for USA (Available in the public folder of my-rill-project in our rill example repository)
Once this is added to public/us-states.json of your Rill project directory, we can try to ask OpenAI to create a map visualization. Note this might take a few tiems and it's not perfect.
In my example, I input the following prompt:
Using table as the data, I want to look up the state column from public/us-states.json. The GeoJSON data has its features inside the features array, and I want to match the state field with properties.NAME. Do not add fields: ["geometry"]. Instead, assign the entire GeoJSON feature as geo, without isolating any specific fields. I will use geo for shape encoding, and color will be determined by total_sales. The projection should be albersUsa.
As this is using AI to generate the the vega_lite spec, there is no guarantee that you will get the results you are looking for everytime. In the above example, we had to provide quite a detailed prompt in order for the generated result to satisfy the requirements and a correct chart to be displayed.

Just like that, you have a vega-lite powered map that you can add to your canvas dashboard. Like any other component, you can add input variables to filter this map and make an interactive experience for your users.