Data Widgets
Data widgets in Rill Canvas allow you to display raw data in various formats. These widgets are perfect for showing detailed information, metrics, and tabular data. For more information, refer to our Components reference doc.
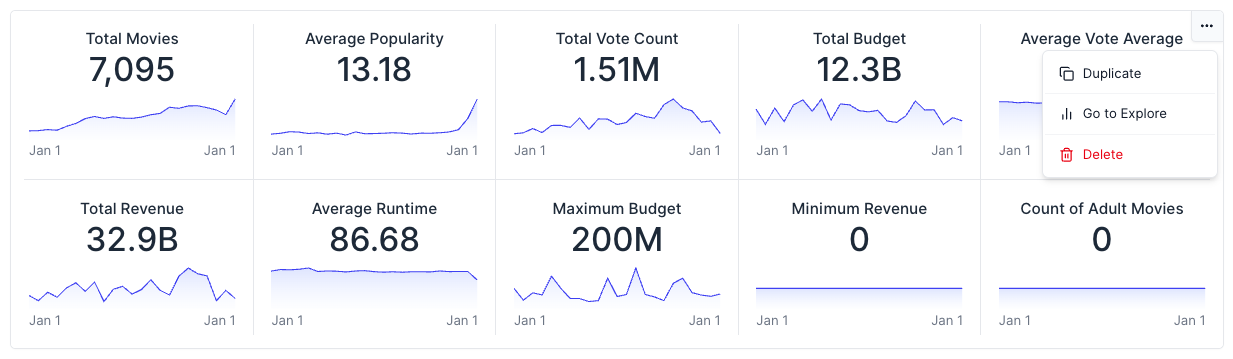
KPI Grid
KPI grids display key performance indicators in a compact grid format with comparison capabilities. You can select up to 10 concurrent measures to display in a single widget
Preview
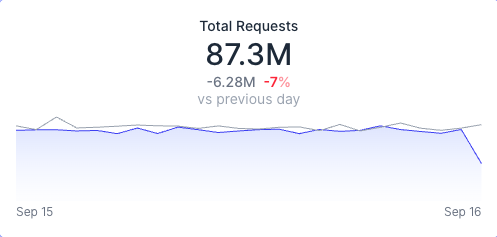
Inline Code
- kpi_grid:comparison:- delta- percent_changemetrics_view: auction_metricsmeasures:- requests
Leaderboard
Leaderboards show ranked data with the top performers highlighted.
Preview
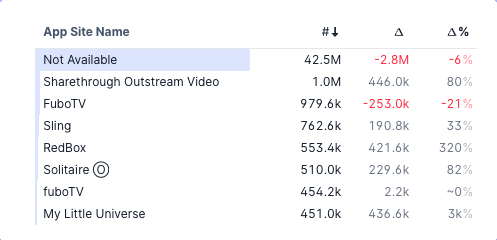
Inline Code
- leaderboard:measures:- requestsmetrics_view: auction_metricsnum_rows: 7dimensions:- app_site_name
Pivot/Table
Tables display detailed data in a structured format with customizable columns.
Preview
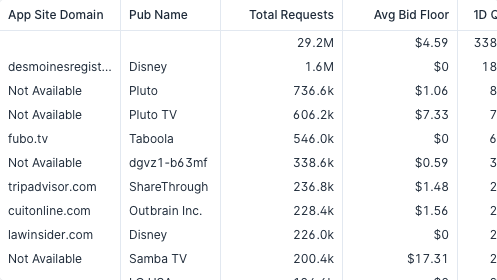
Inline Code
- table:columns:- app_site_domain- pub_name- requests- avg_bid_floor- 1d_qpsmetrics_view: auction_metrics
Navigation
All Data widgets also provide a button to "Go to explore" that can navigate to the Explore dashboard if available.