Filters & Comparisons
If videos are more your jam, take a look at our series of YouTube videos to get started!
Overview
Rill is particularly suited for exploratory analysis - to be able to slice & dice data quickly. As such, there are a variety of filter types and filter mechanisms throughout the app. The goal for each Rill dashboard is to provide users with all metrics and dimensions required for each use case and create an interactive experience to cut data in any form.
With the release of v0.52, we have introduced an easy way to craft specific views by modifying the URL directly. As you select filters, time ranges, and default dimension and measures, the URL will change accordingly.
.../explore/explore_dashboard?tr=P3M&compare_tr=rill-PP&f=dimension in ('exampleA', 'exampleB')
Add / Hide Dimensions and Metrics
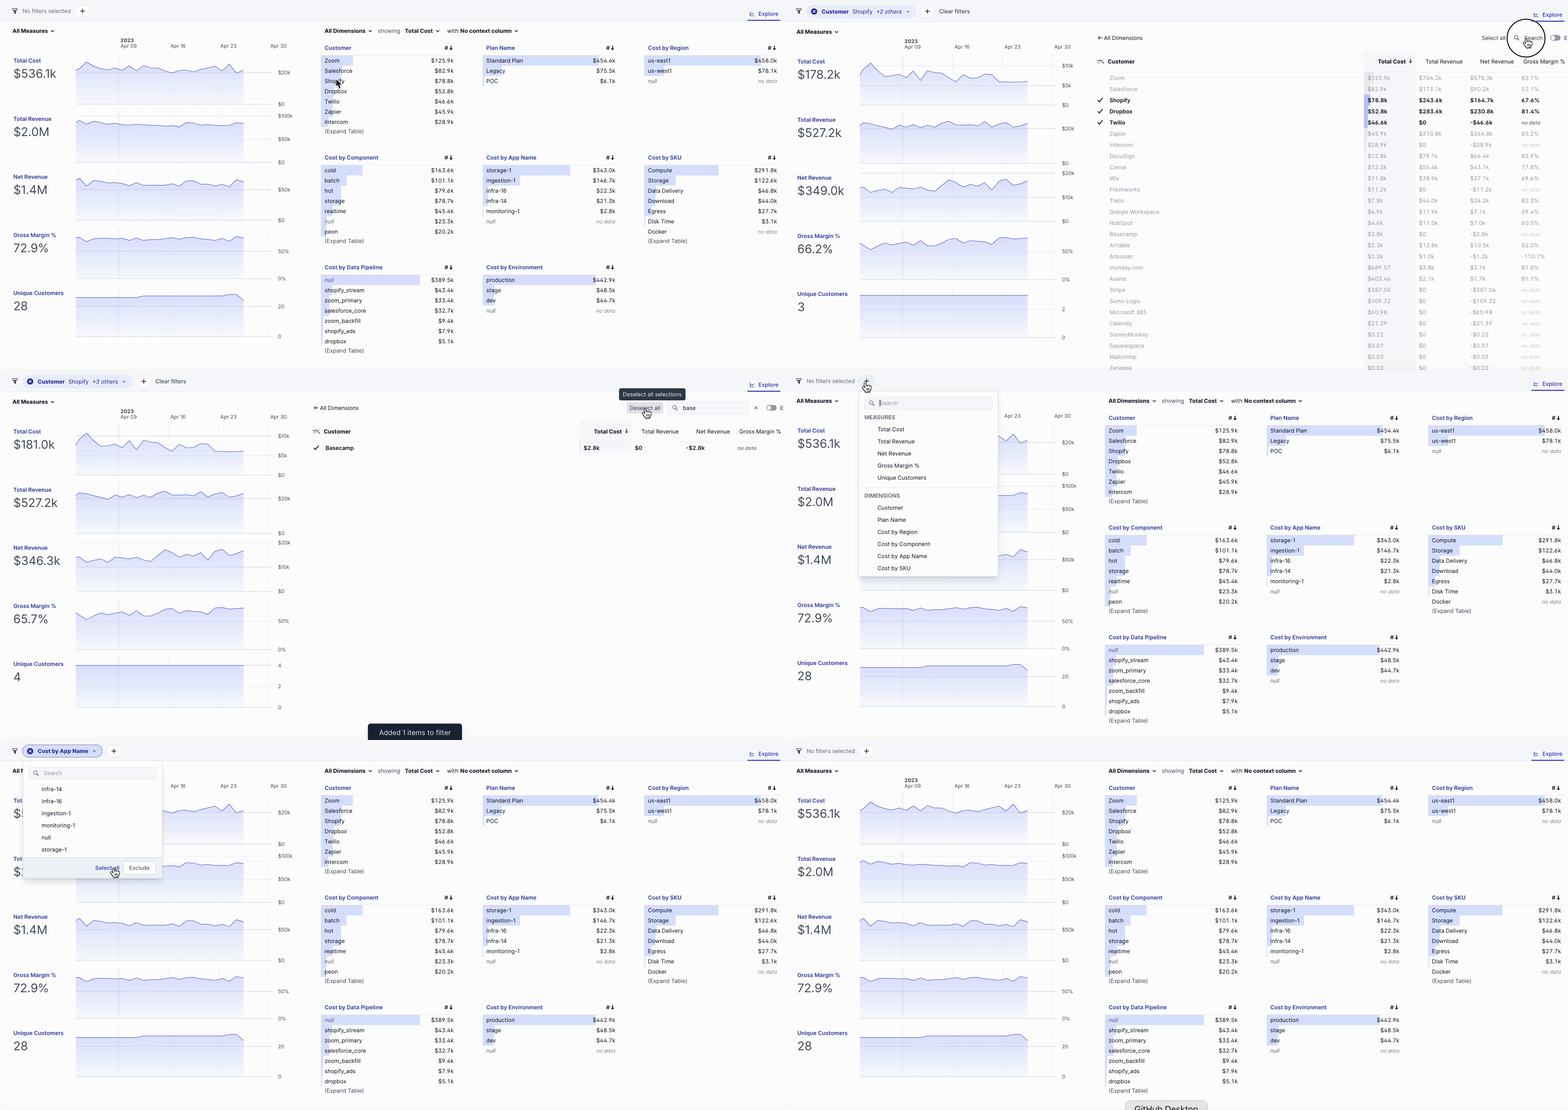
Users can add or hide dimensions and metrics to a subset of fields they wish to see at any given time. At the top left, above the time series and above the top left leaderboard, you'll find the Measures & Dimensions selectors to add or hide from the page. In the example below, network and country are deselected so would be hidden from view.

You can also change settings in the dashboard configuration to hide certain fields by default. You may want to do this to make dashboards easier to use (less complicated, narrowed to most commonly used) and to improve performance (hide high cardinality dimensions or complicated expressions in metrics). For more details, check out dashboard customizations.
Or, an administrator can set the default view of a dashboard by bookmarking the view as Home.
Dimensions
Filter by Dimensions
The primary/easiest way to filter data is by selecting values in the dimension tables. Leaderboards within Rill are fully interactive. Selecting any dimension in the table will automatically filter the remaining leaderboards and metrics by that selection.
To add or remove dimensions on the page - select the All Dimensions picker above the Leaderboards. Next to the All Dimensions picker, you can also change which Metric is being highlighted to be able to update the entire page and cycle through each dimension table sorted by each metric.
You can also expand each dimension table to see all metrics and full list of those dimensions. In the expanded Leaderboard, you can search for dimension values, select all values returned, or exclude values from the result.
Any filter applied in the Leaderboard will also show up in the filter bar at next to the time picker. You can apply the same search capabilities and select features in the filter bar as well.

Dimension Comparisons
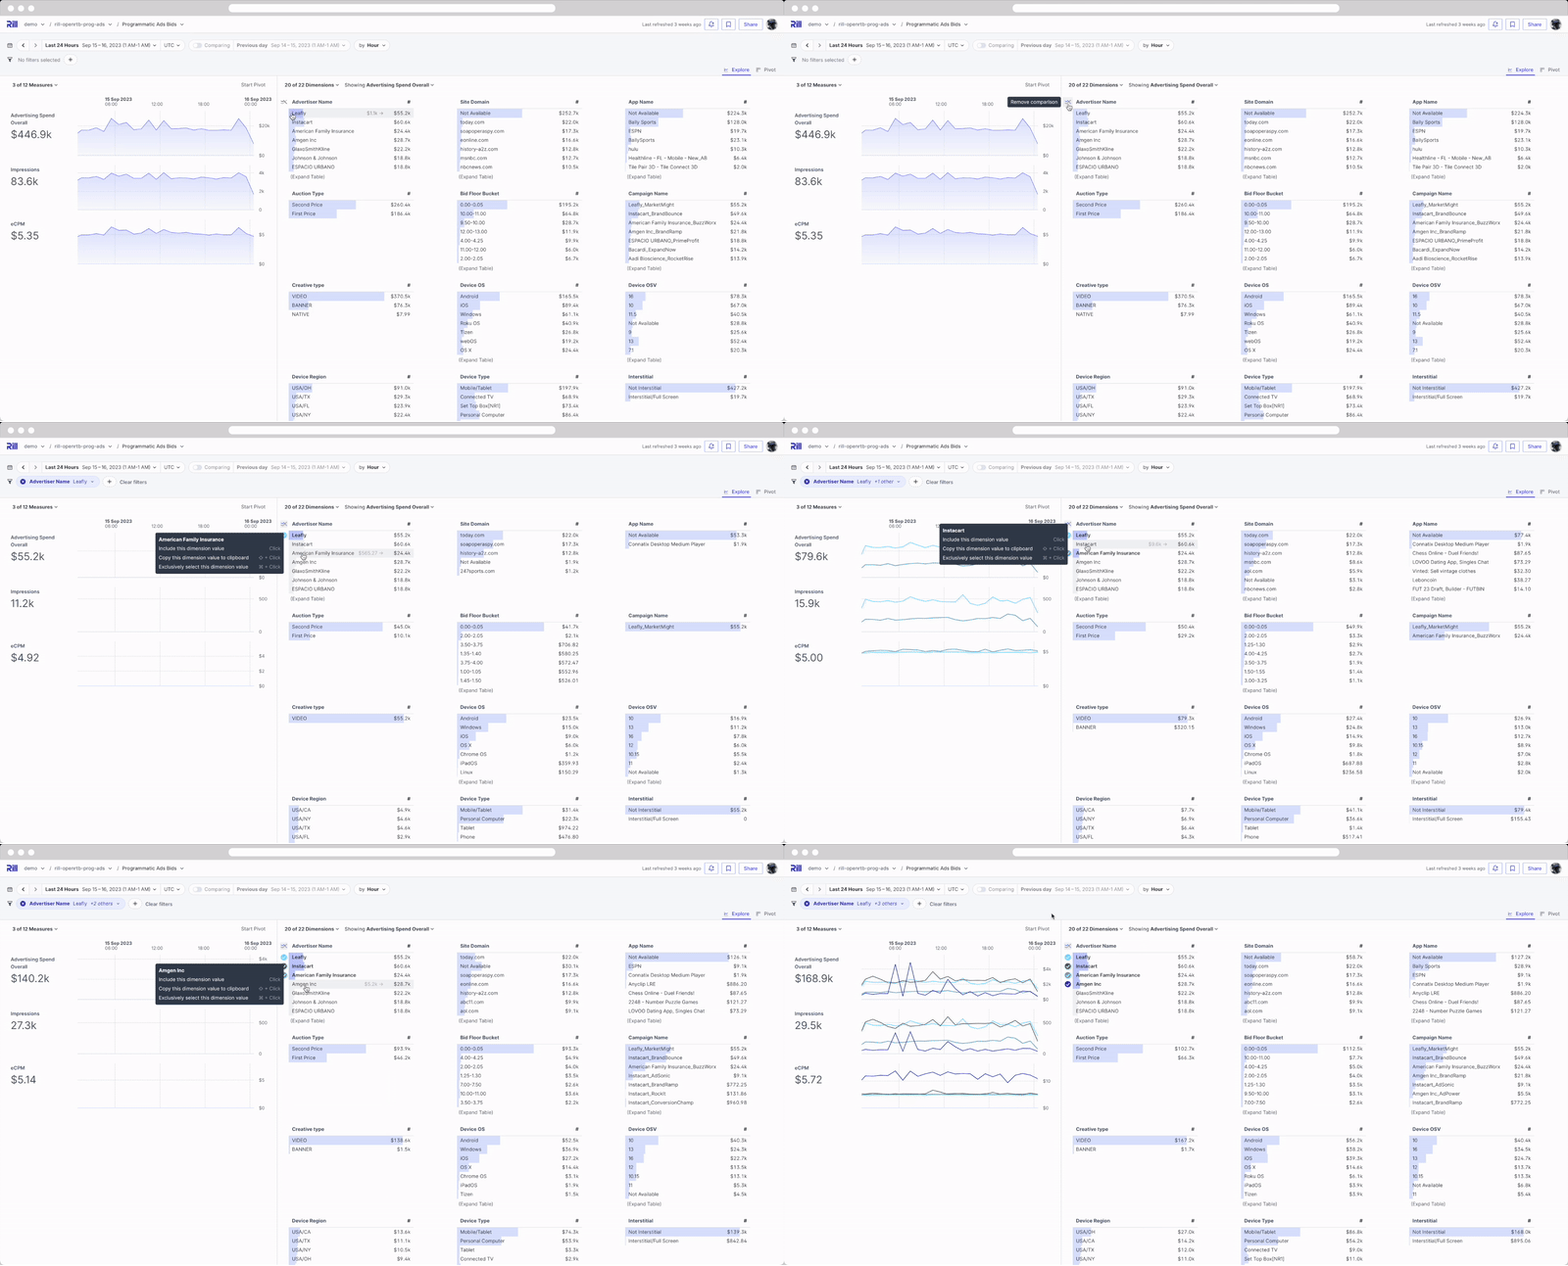
In addition to time comparisons, you can select multiple dimension values to compare trends of those specific data points. Select the comparison option on the top left of any leaderboard and select multiple dimensions
Deselect the comparison option or clear the filter bar to remove your comparisons.

For more advanced time and dimension comparisons, visit the Time Dimension Detail page.
Measures
Filter by Measures
There are also use cases where you want to filter by the metric values returned. As an example - all customers over $1000 in revenue, all campaigns with at least 1 million impressions, all delivery locations with late times over 4%, etc.
To add or remove metrics on the page - select the All Measures picker above the Time Series charts.
These metric filters can be applied from the filter bar. To apply a metric filter:
- Select the metric you wish to filter by (e.g. Total Cost)
- Select which dimension to sort/key the metric by (e.g. Cost by Region)
- Select your Threshold Type (e.g. Great Than)
- Input your Threshold amount and Click Enter

Metric filters are a good way to "sort" by two different metrics. First, apply your metric threshold. Then, sort by your metrics within the Leaderboard to do multi-metric sorting.
As an example - to see most active enterprise customers - filter all customers with revenue greater than $1000 then sorted by number of users increased descending.