Contextual AI Chat
Overview
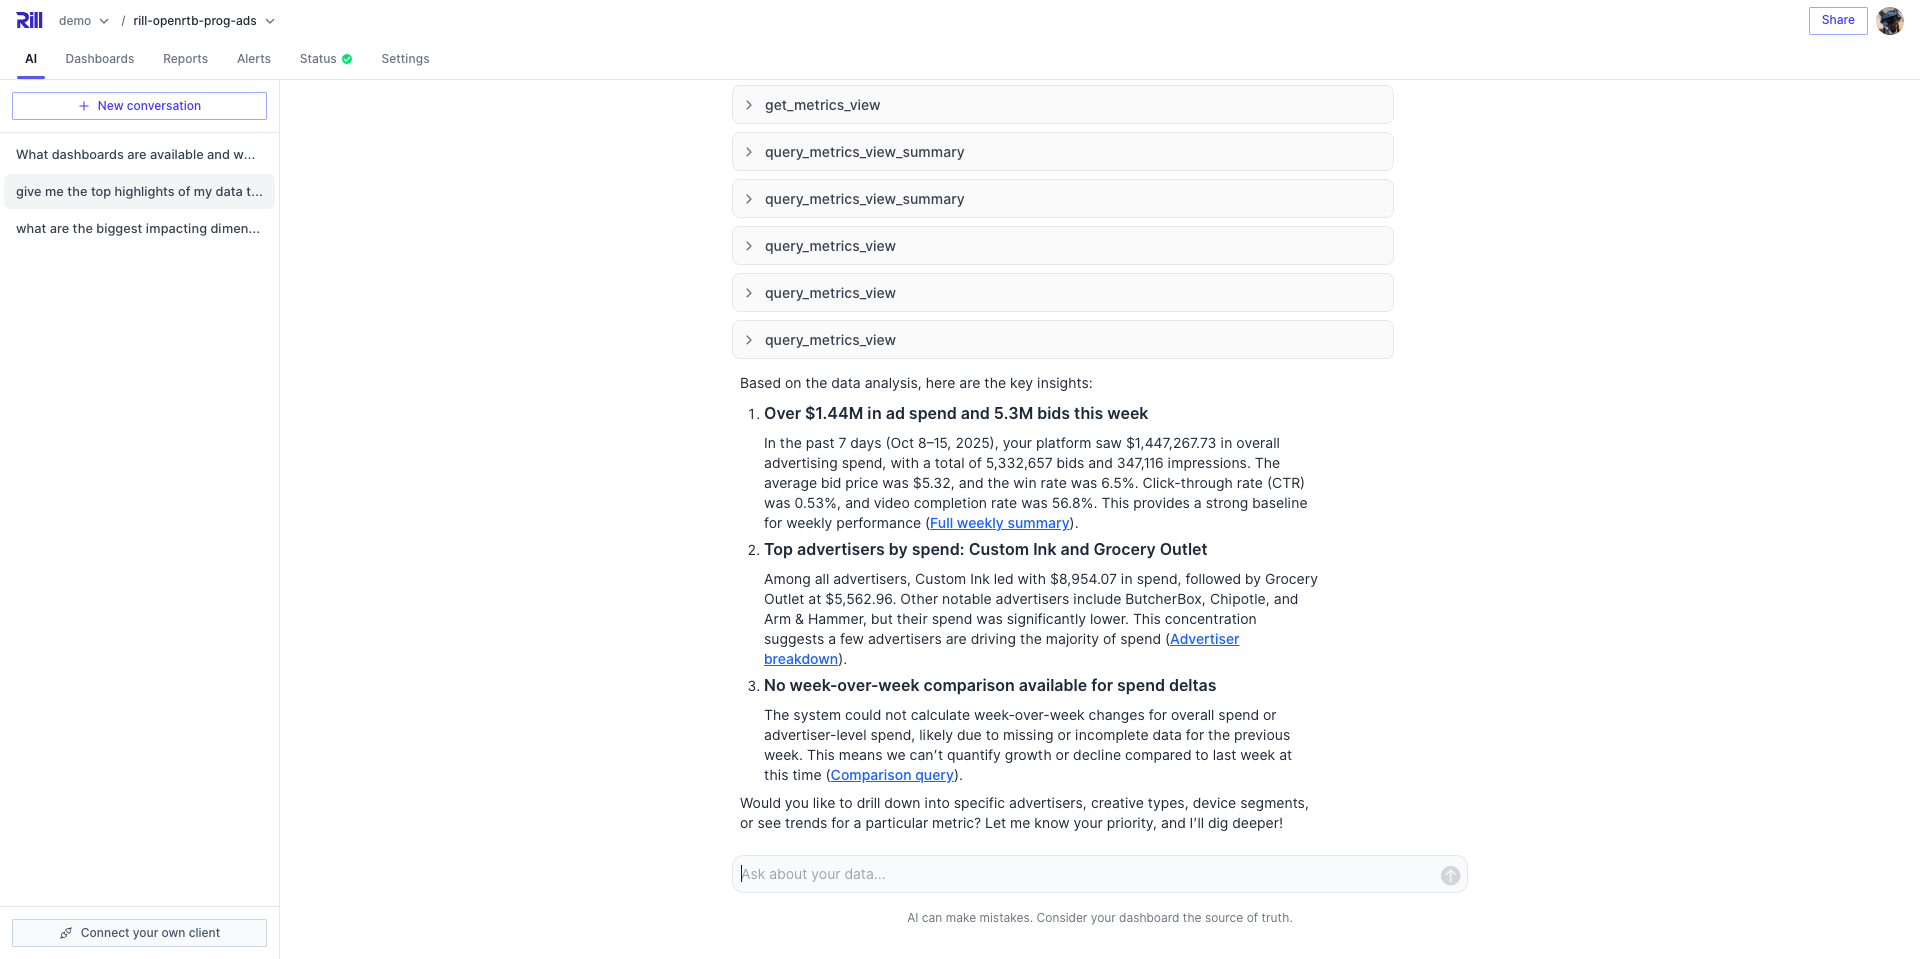
AI Chat in Rill Cloud allows you to have natural language conversations with your data directly in your browser. Instead of building queries or navigating through dashboards, simply ask questions using everyday conversational language and get instant insights backed by your metrics views—complete with interactive charts and visualizations that render right in the chat interface, plus direct links to your existing dashboards for deeper exploration.
AI Chat is powered by Rill's Model Context Protocol (MCP) integration, which ensures that responses are accurate, governed, and consistent with the metrics displayed in your dashboards. By querying data with predefined measures and dimensions, you can trust that the answers you receive are as reliable as the data in your Rill dashboards.
What makes AI Chat different? Every response includes direct links to your Explore dashboards with filters pre-applied, so you can always verify where the numbers came from. No black box—just transparent, trustworthy analytics.

How It Works
AI Chat uses the same Rill MCP Server technology that powers external AI integrations with tools like Claude Desktop. This means:
- Fast! - Get instant answers powered by Rill's optimized query engine
- Accurate Responses - The Agent only queries metrics views you've already defined, ensuring accuracy and consistency
- Secure Data Access - Respects your project's access controls and user permissions
Accessing AI Chat
Access AI Chat from Project Home
- Navigate to your Rill Cloud project home page
- Click on the AI tab in the project navigation
- Start typing your question in the chat interface
Access AI Chat from a Dashboard
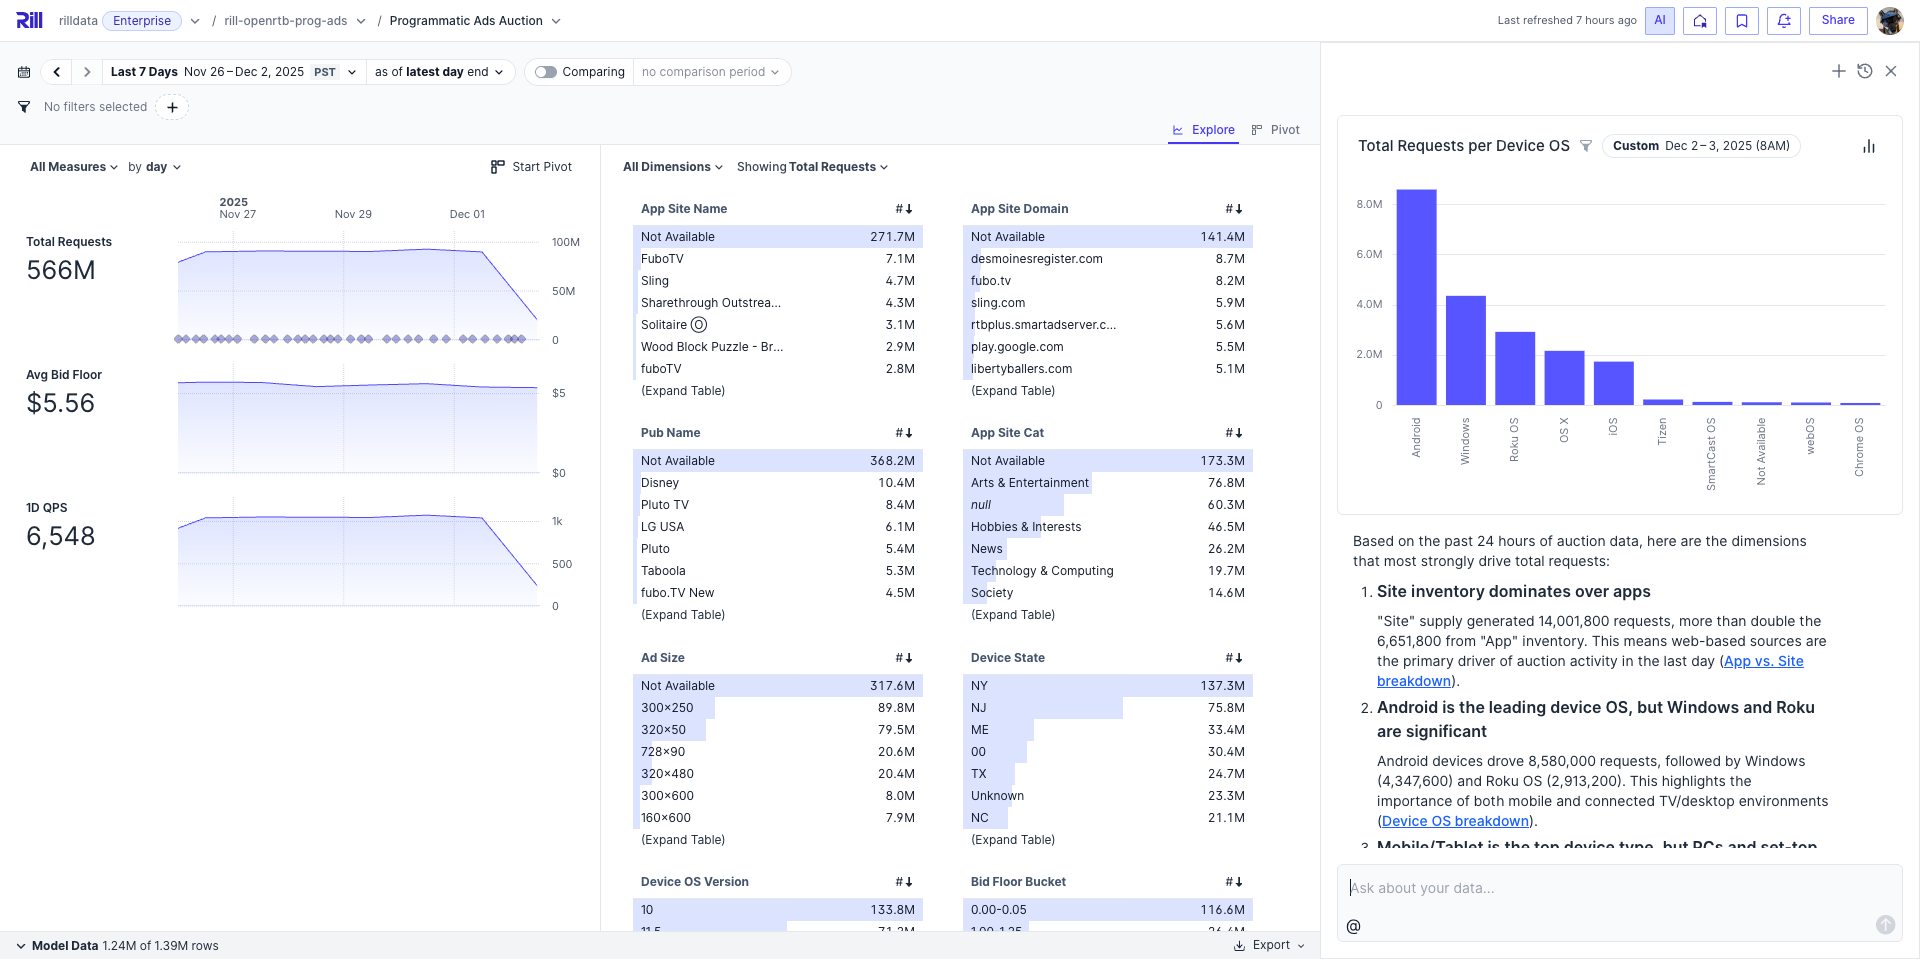
You can also access AI Chat directly while exploring a dashboard, making it easy to ask questions about what you're currently viewing:
- While viewing any Explore dashboard, look for the AI Chat icon in the top navigation bar
- Click the AI Chat icon to open the chat panel alongside your dashboard
- Ask questions about the data you're currently viewing

When you open AI Chat from a dashboard, the AI is automatically aware of:
- Current dashboard context - The metrics view you're viewing
- Applied filters - Any dimension or measure filters you've set
- Time range - The time period currently selected
- Comparison settings - Any active time comparisons
This context-aware functionality means you can ask questions like:
- "Why did this measure spike?" (referring to what's visible on screen)
- "What's driving this change?" (analyzing the current time period)
- "Show me more details about these results" (diving deeper into filtered data)
Opening AI Chat from within a dashboard allows for more natural, context-aware questions. The AI understands what you're looking at, so you don't need to repeat filters or time ranges in your questions.
Understanding Responses
AI Chat provides rich, multi-layered responses to help you understand your data quickly while maintaining easy access to deeper exploration:
What's Included in Responses
-
Summary - A concise answer to your question with key findings and insights
-
Interactive Visualizations - Charts and graphs that help you see patterns at a glance. The AI automatically chooses the most appropriate visualization based on your data and question, including:
- Line charts - Show trends and changes over time
- Area charts - Highlight cumulative trends and patterns
- Bar charts - Compare values across categories or dimensions
- Stacked bar charts - Show part-to-whole relationships across categories
- Donut charts - Display proportional breakdowns of a total
- Combo charts - Combine multiple measures with different scales
- Heatmaps - Visualize distribution across two dimensions
-
Detailed Results - Tables or lists with specific numbers and breakdowns
-
Dashboard Links - Direct links to your existing Explore dashboards with filters and time ranges pre-applied based on your question
-
Suggested Follow-ups - Related questions or areas to investigate further
Visual Components
AI Chat automatically generates interactive visualizations to complement answers when appropriate. The AI intelligently selects chart types based on your data structure, question context, and visualization best practices—while skipping charts when a table or text-only response is more suitable.
Linking Back to Dashboards
Trust the numbers. The most powerful feature of AI Chat is its transparency. When the AI answers your question, it automatically generates links to your Explore dashboards, allowing you to see exactly where the numbers came from.
Every AI response includes dashboard links that:
- Pre-apply relevant filters - The dashboard opens with filters matching your question context
- Set appropriate time ranges - Time periods from your question are automatically selected
- Enable comparison periods - When you ask about changes, comparison views are activated
This means you can verify every answer by clicking through to the full dashboard. No black box—just transparent, trustworthy analytics. Start with a quick AI summary, then explore the underlying data with full confidence in its accuracy.
Improving AI Chat with Instructions
To get the most accurate and contextual responses from AI Chat, you can add custom ai_instructions to your project files. These instructions provide the AI with additional context about your data, business logic, and preferred response formats.
Why Add AI Instructions?
AI instructions help the AI:
- Understand your specific business context and terminology
- Format responses in ways that match your team's preferences
- Focus on the metrics and dimensions most relevant to your use case
Where to Add Instructions
You can add ai_instructions in two places:
rill.yaml- Project-wide instructions that apply to all queries across your entire project<metrics_view>.yaml- Metrics view-specific instructions for individual dashboards
For detailed examples and best practices on writing effective AI instructions, see the AI Configuration guide.
Use in Your Favorite AI Client
Prefer to chat with your data in Claude Desktop, ChatGPT, or another AI assistant? You can connect your Rill projects to external AI clients using the Rill MCP Server. This gives you the same governed, accurate analytics experience—powered by your predefined metrics—but integrated into your preferred AI workflow. Perfect for data teams who want deep analysis sessions, local development access, or integration with other tools. See the Rill MCP Server documentation to learn more.
Need Help?
Contact our team if you have questions or feedback about AI Chat!