Dashboards in Rill
Rill offers two distinct dashboard experiences, each optimized for different use cases and user needs. While both are used to visualize your data, the key difference lies in how they handle metrics views - the data sources that power your dashboards.
- Explore Dashboards - Standardized opinionated dashboards with consistent data components, visualizations, and layout structure that promote slice-and-dice discovery and interactive data exploration. These are built over a single metrics view using the One Big Table approach.
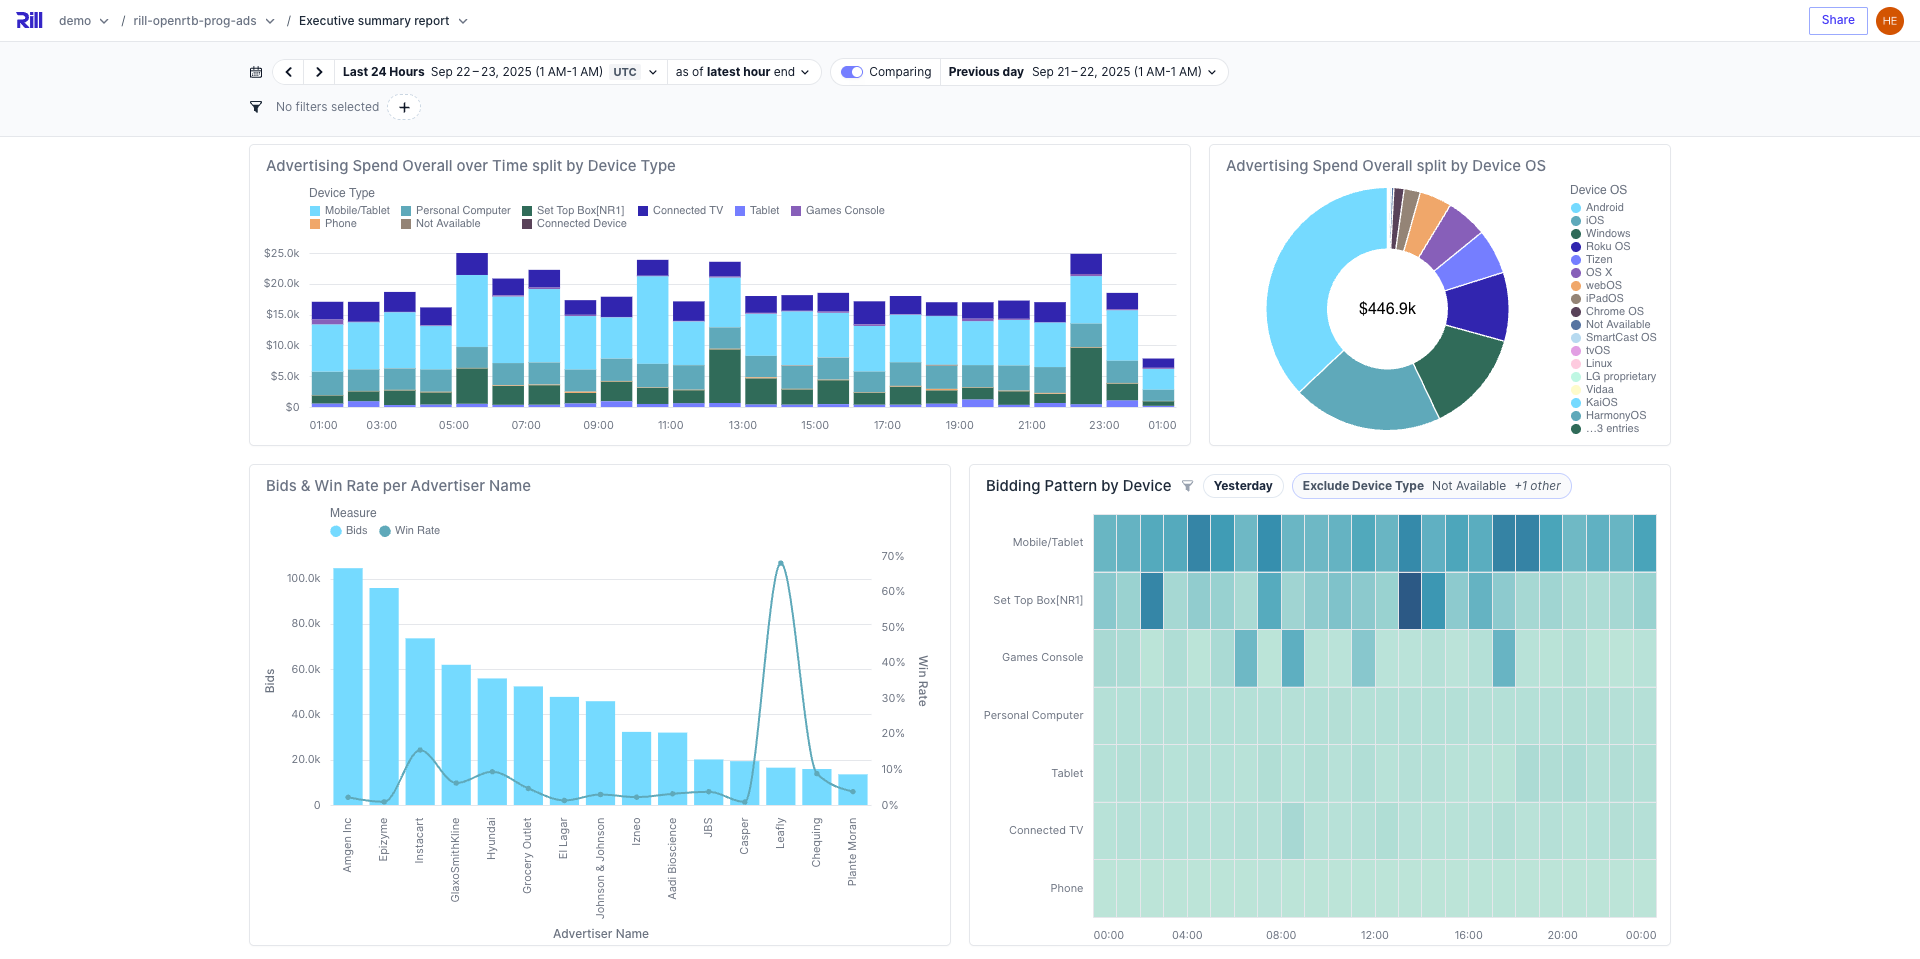
- Canvas Dashboards - Traditional dashboards that allow users to customize visualizations and layout according to their specific requirements utilizing multiple metrics views.
Explore Dashboards
Explore dashboards are designed for interactive data exploration and analysis. They provide a powerful "slice and dice" experience focused on a single metrics view. Some key features of our Explore dashboards include:

Live Demo
See both dashboard types in action with our interactive demos:
- Programmatic Advertising Explore Dashboard - Real-time bidding and auction data exploration
- Mobile App Engagement Explore Dashboard - Mobile app user behavior and engagement metrics
- GitHub Analytics Explore Dashboard - Code repository and commit analysis
- E-commerce Explore Dashboard - Interactive exploration of sales data
Canvas Dashboards
Canvas dashboards provide a traditional dashboard experience where you can combine multiple metrics views and create custom layouts. See our list of components to start creating your custom dashboard.

Live Demo
See both dashboard types in action with our interactive demos:
- E-commerce demo dashboard - Sales analytics and revenue tracking with multiple visualizations
- Programmatic advertising demo dashboard - Real-time bidding metrics and campaign performance analysis
- New York City demo dashboard - Urban analytics and city performance metrics
- NYC party demo dashboard 🎉 - Fun leaderboard showcasing various data insights
Key Features
Both dashboard types share common capabilities that make them powerful for data analysis:
- Time filtering and comparisons - Navigate through time periods and compare different time ranges
- Dimension filtering - Filter data by specific dimensions and values
Learn More About Using Dashboards
For comprehensive guidance on using dashboards as an analyst, see our Analyst's Guide to Dashboards, which covers: