4. Create Explore Dashboard in Rill
Create the explore dashboard
When you're ready, you can create the visualization on top of the metrics layer. Select Create Explore dashboard. This will create a simple explore-dashboards/uk_price_paid_metrics_explore.yaml file that reads in all the dimensions and measures. For more information on the available key-value pairs, please refer to the reference documentation.
What can we do in Rill?
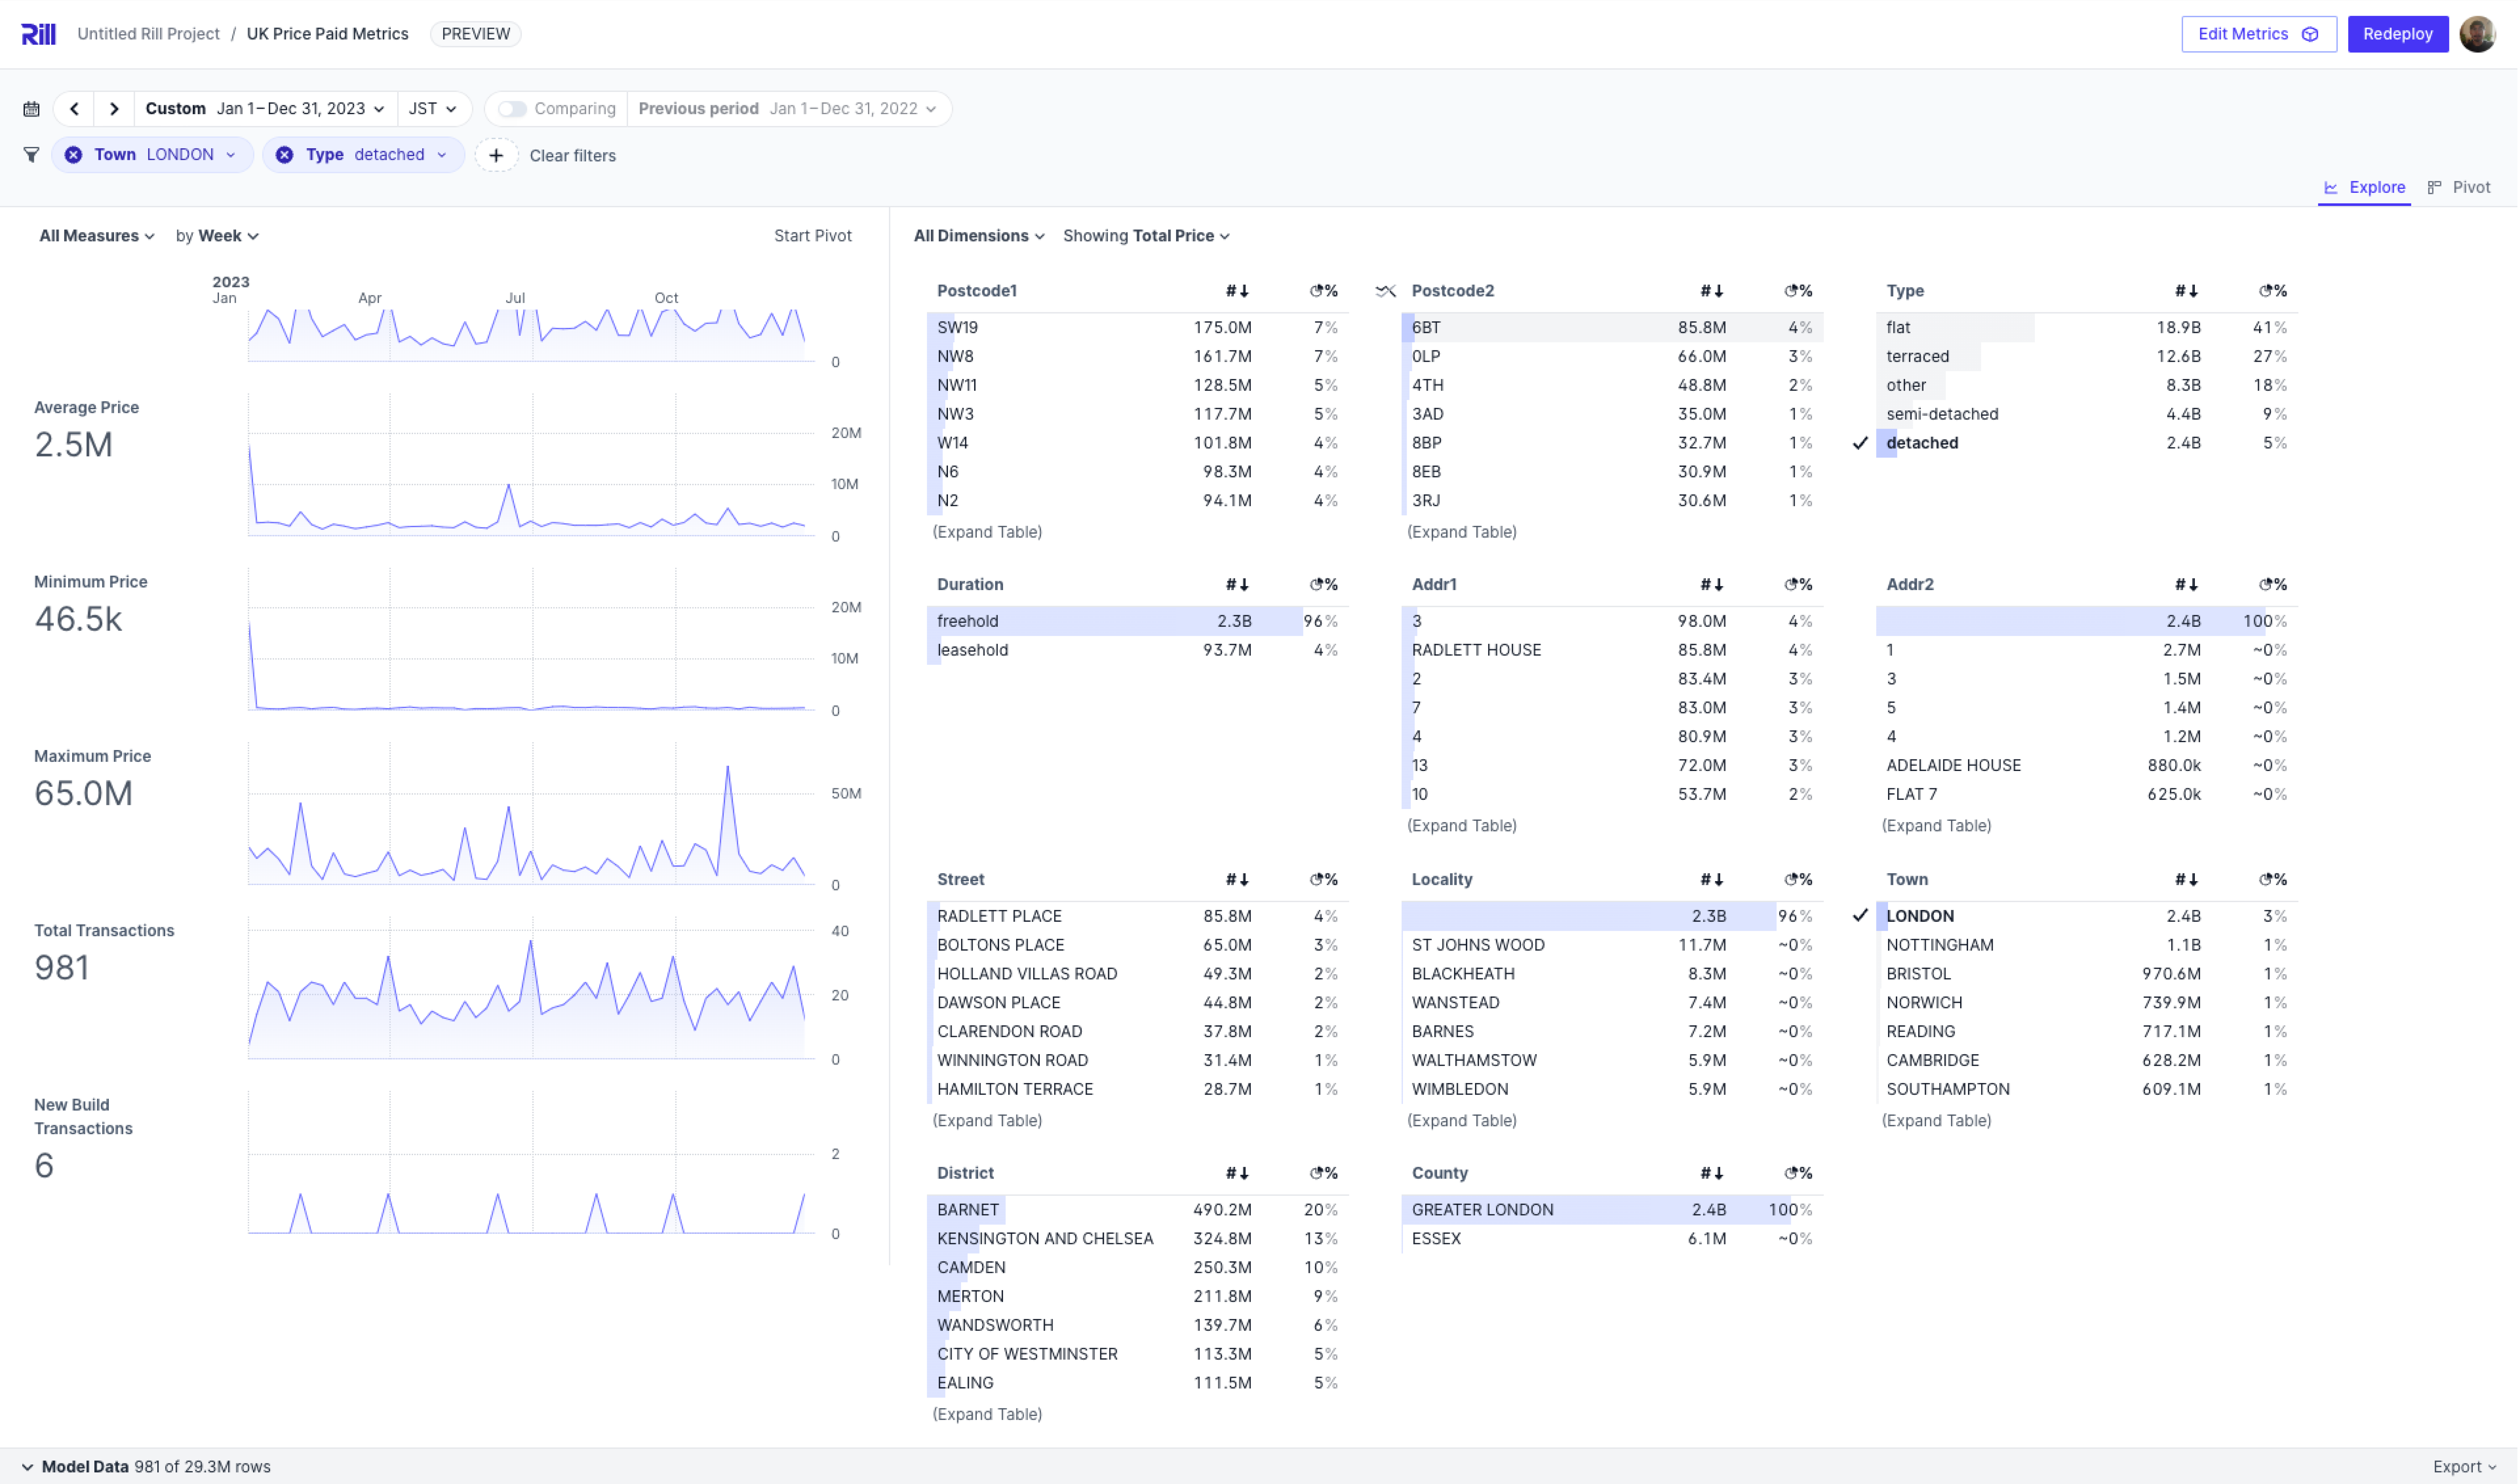
In our case, since we generated this with AI, we can look through the description of the populated measures for more information. Based on this, we can find some specific information on the UK properties dataset at a glance, such as:
- In 2023, what was the minimum/maximum detached property sold in London? [46.5K, 65.0M]
- In 2023, what was the average price of detached properties sold in London? How many? [2.5M, 981]
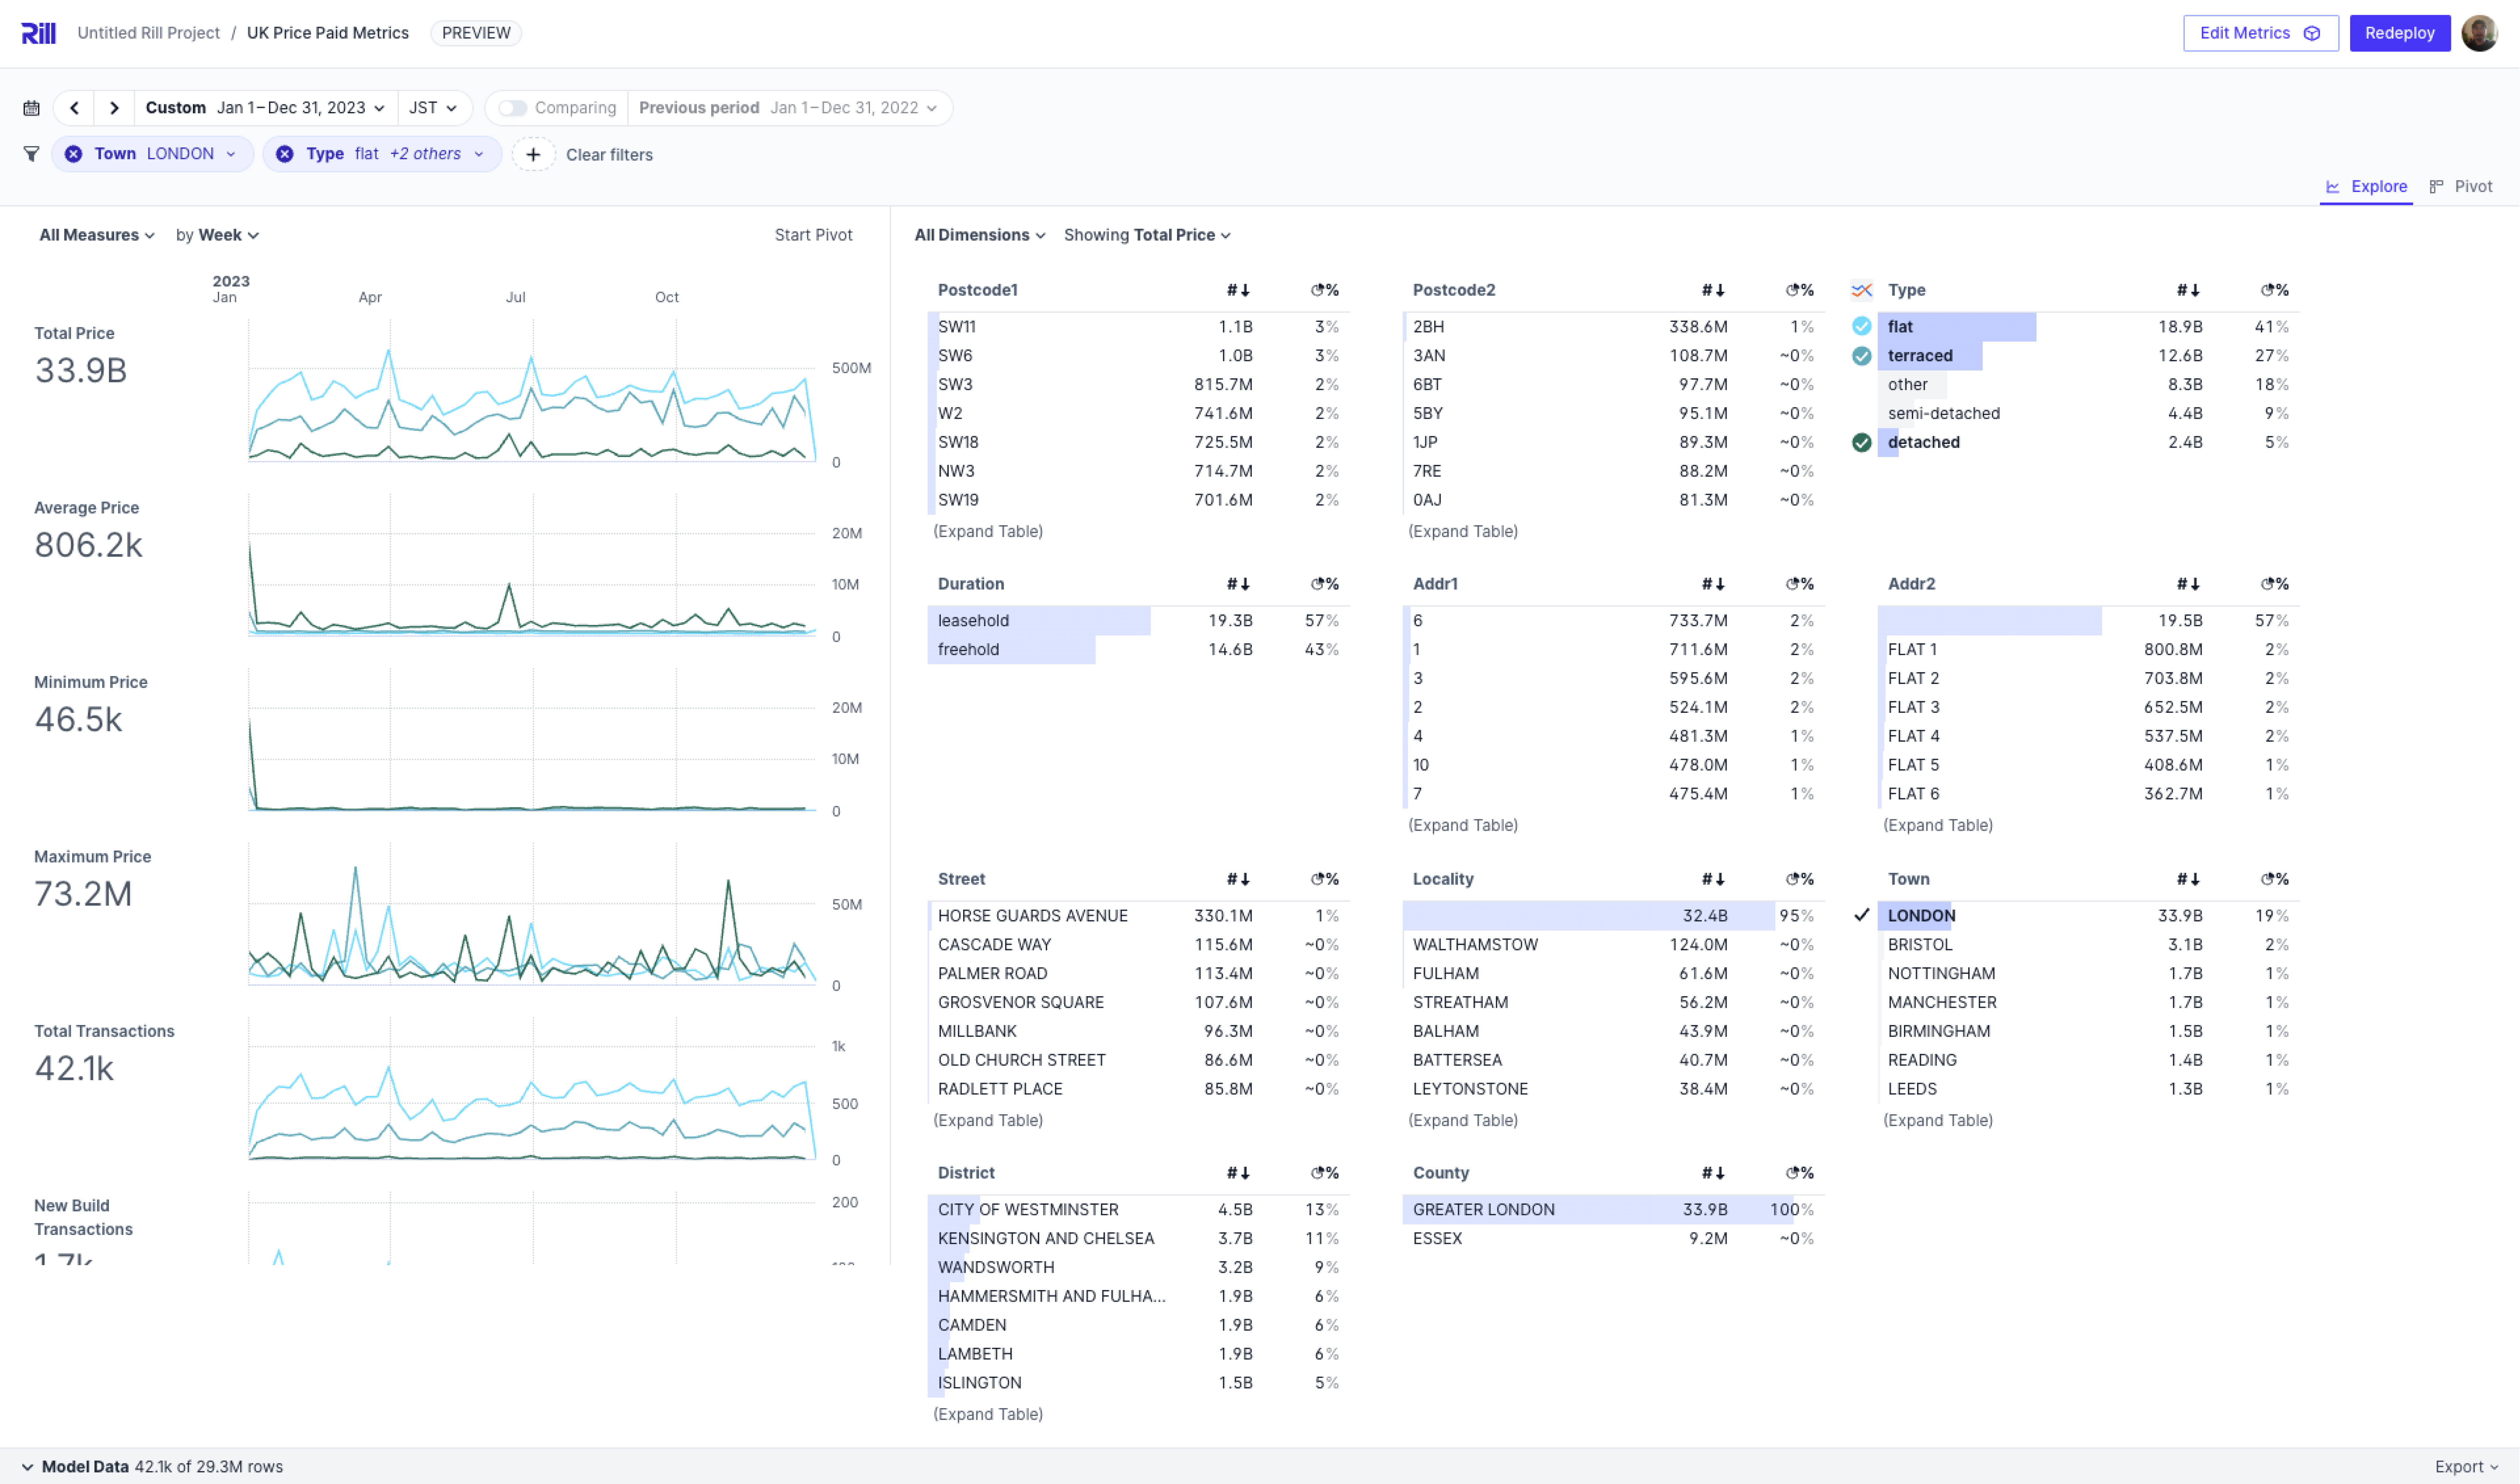
If we want to go further into the details, we can even compare detached vs flat vs terraced properties using our compare feature. Using the x-axis, we can drill down further from the 2023 year into a specific month, week, or even day.
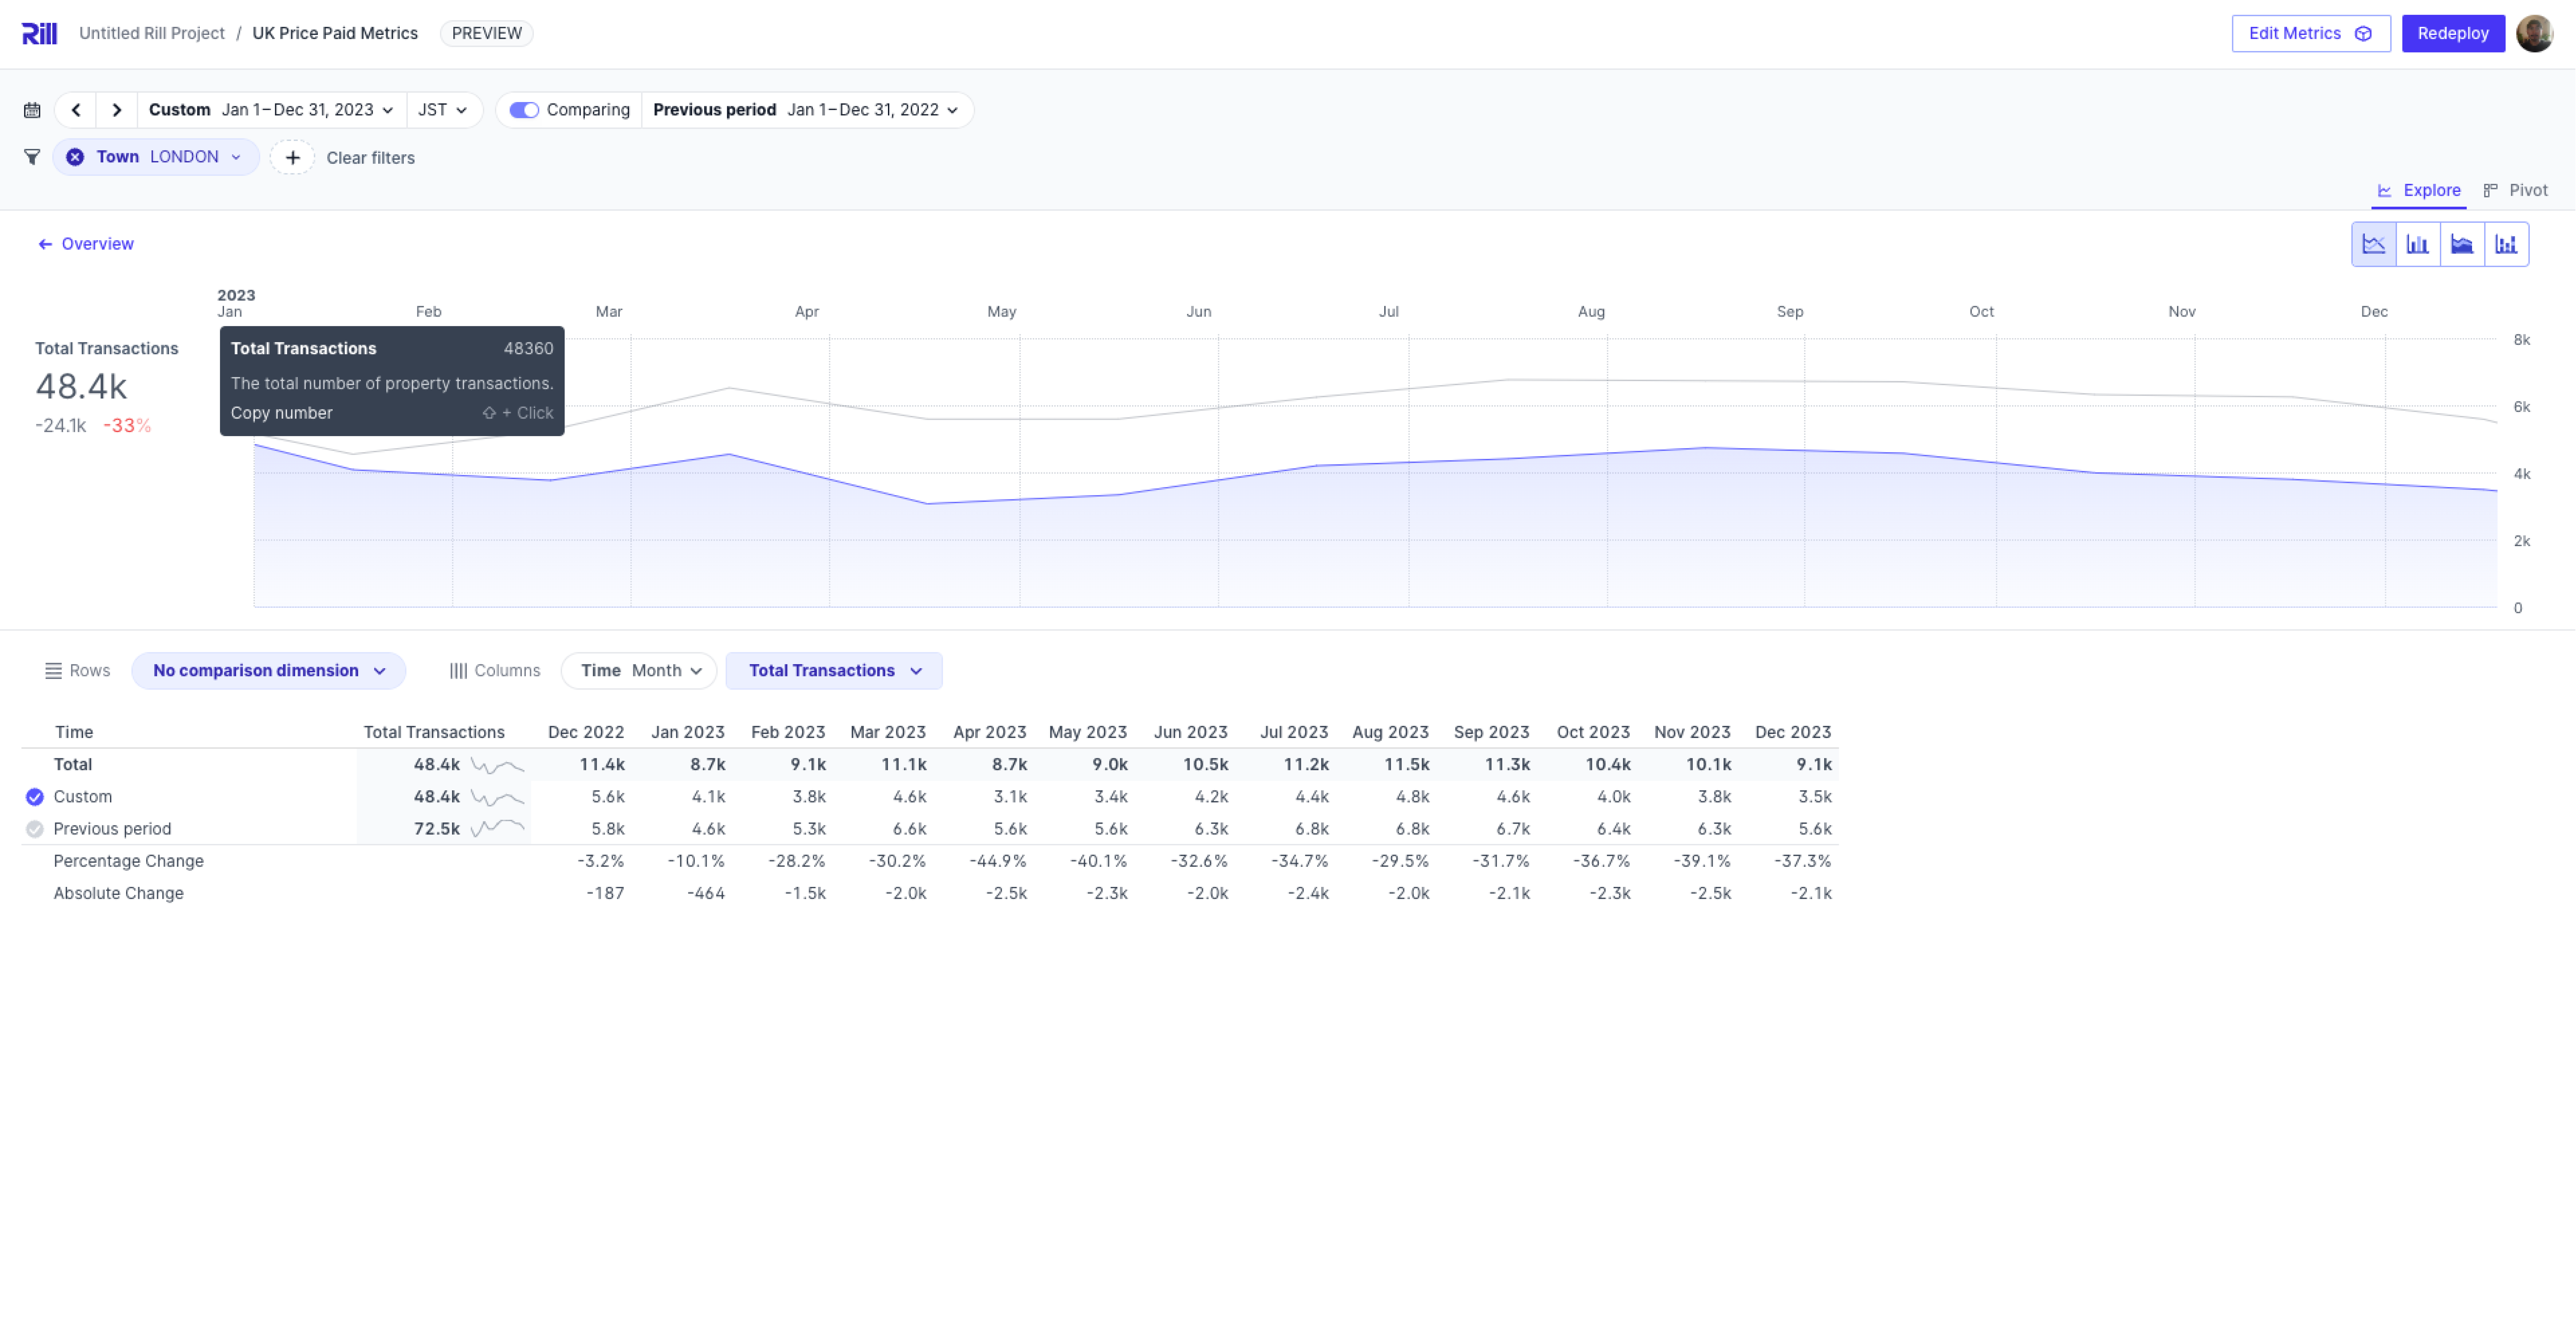
You can also compare total transactions between 2022 and 2023. In the screenshot below, we selected the Total Transactions metric and enabled the time-compare feature to see the delta and delta percent change between the two time periods.