5. Create an Explore and Canvas Dashboard
Explore Dashboard
We have the choice to start with either an Explore or Canvas dashboard. Let's start with an Explore Dashboard by selecting Create Explore Dashboard. This will automatically populate the explore dashboard to select all of the created metrics and dimensions in your metrics view. We can make changes to the view via the YAML or visual dashboard editor.
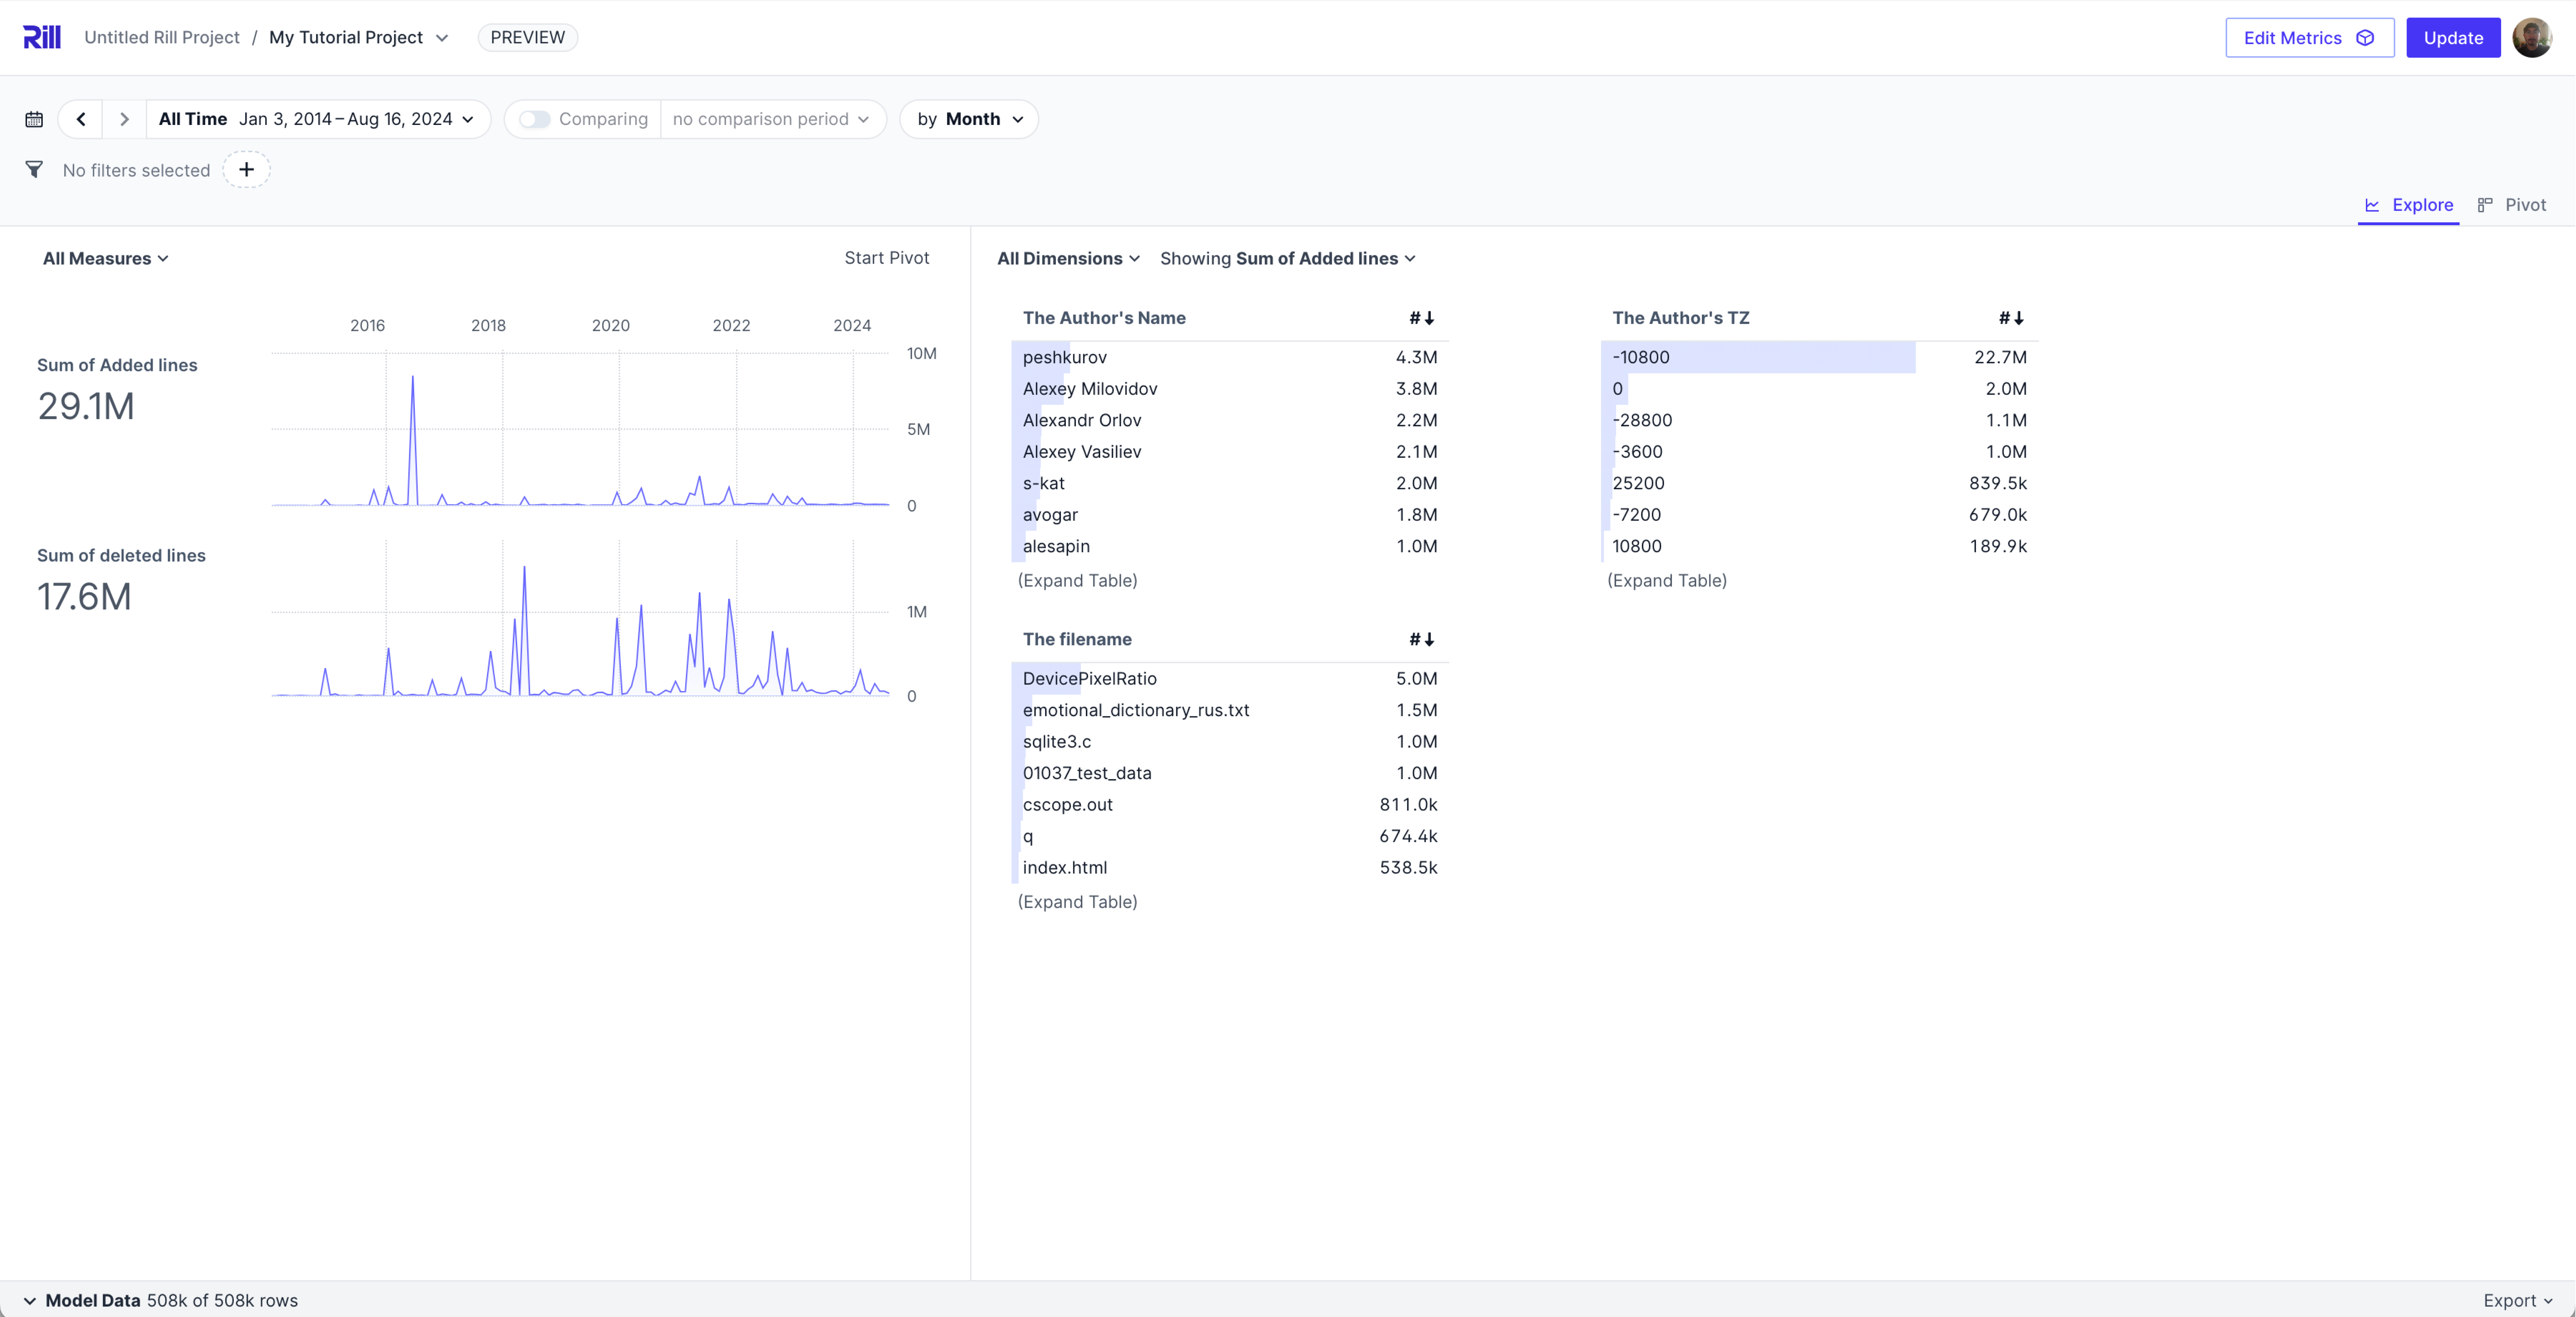
Making Changes
Visual Explore Dashboard
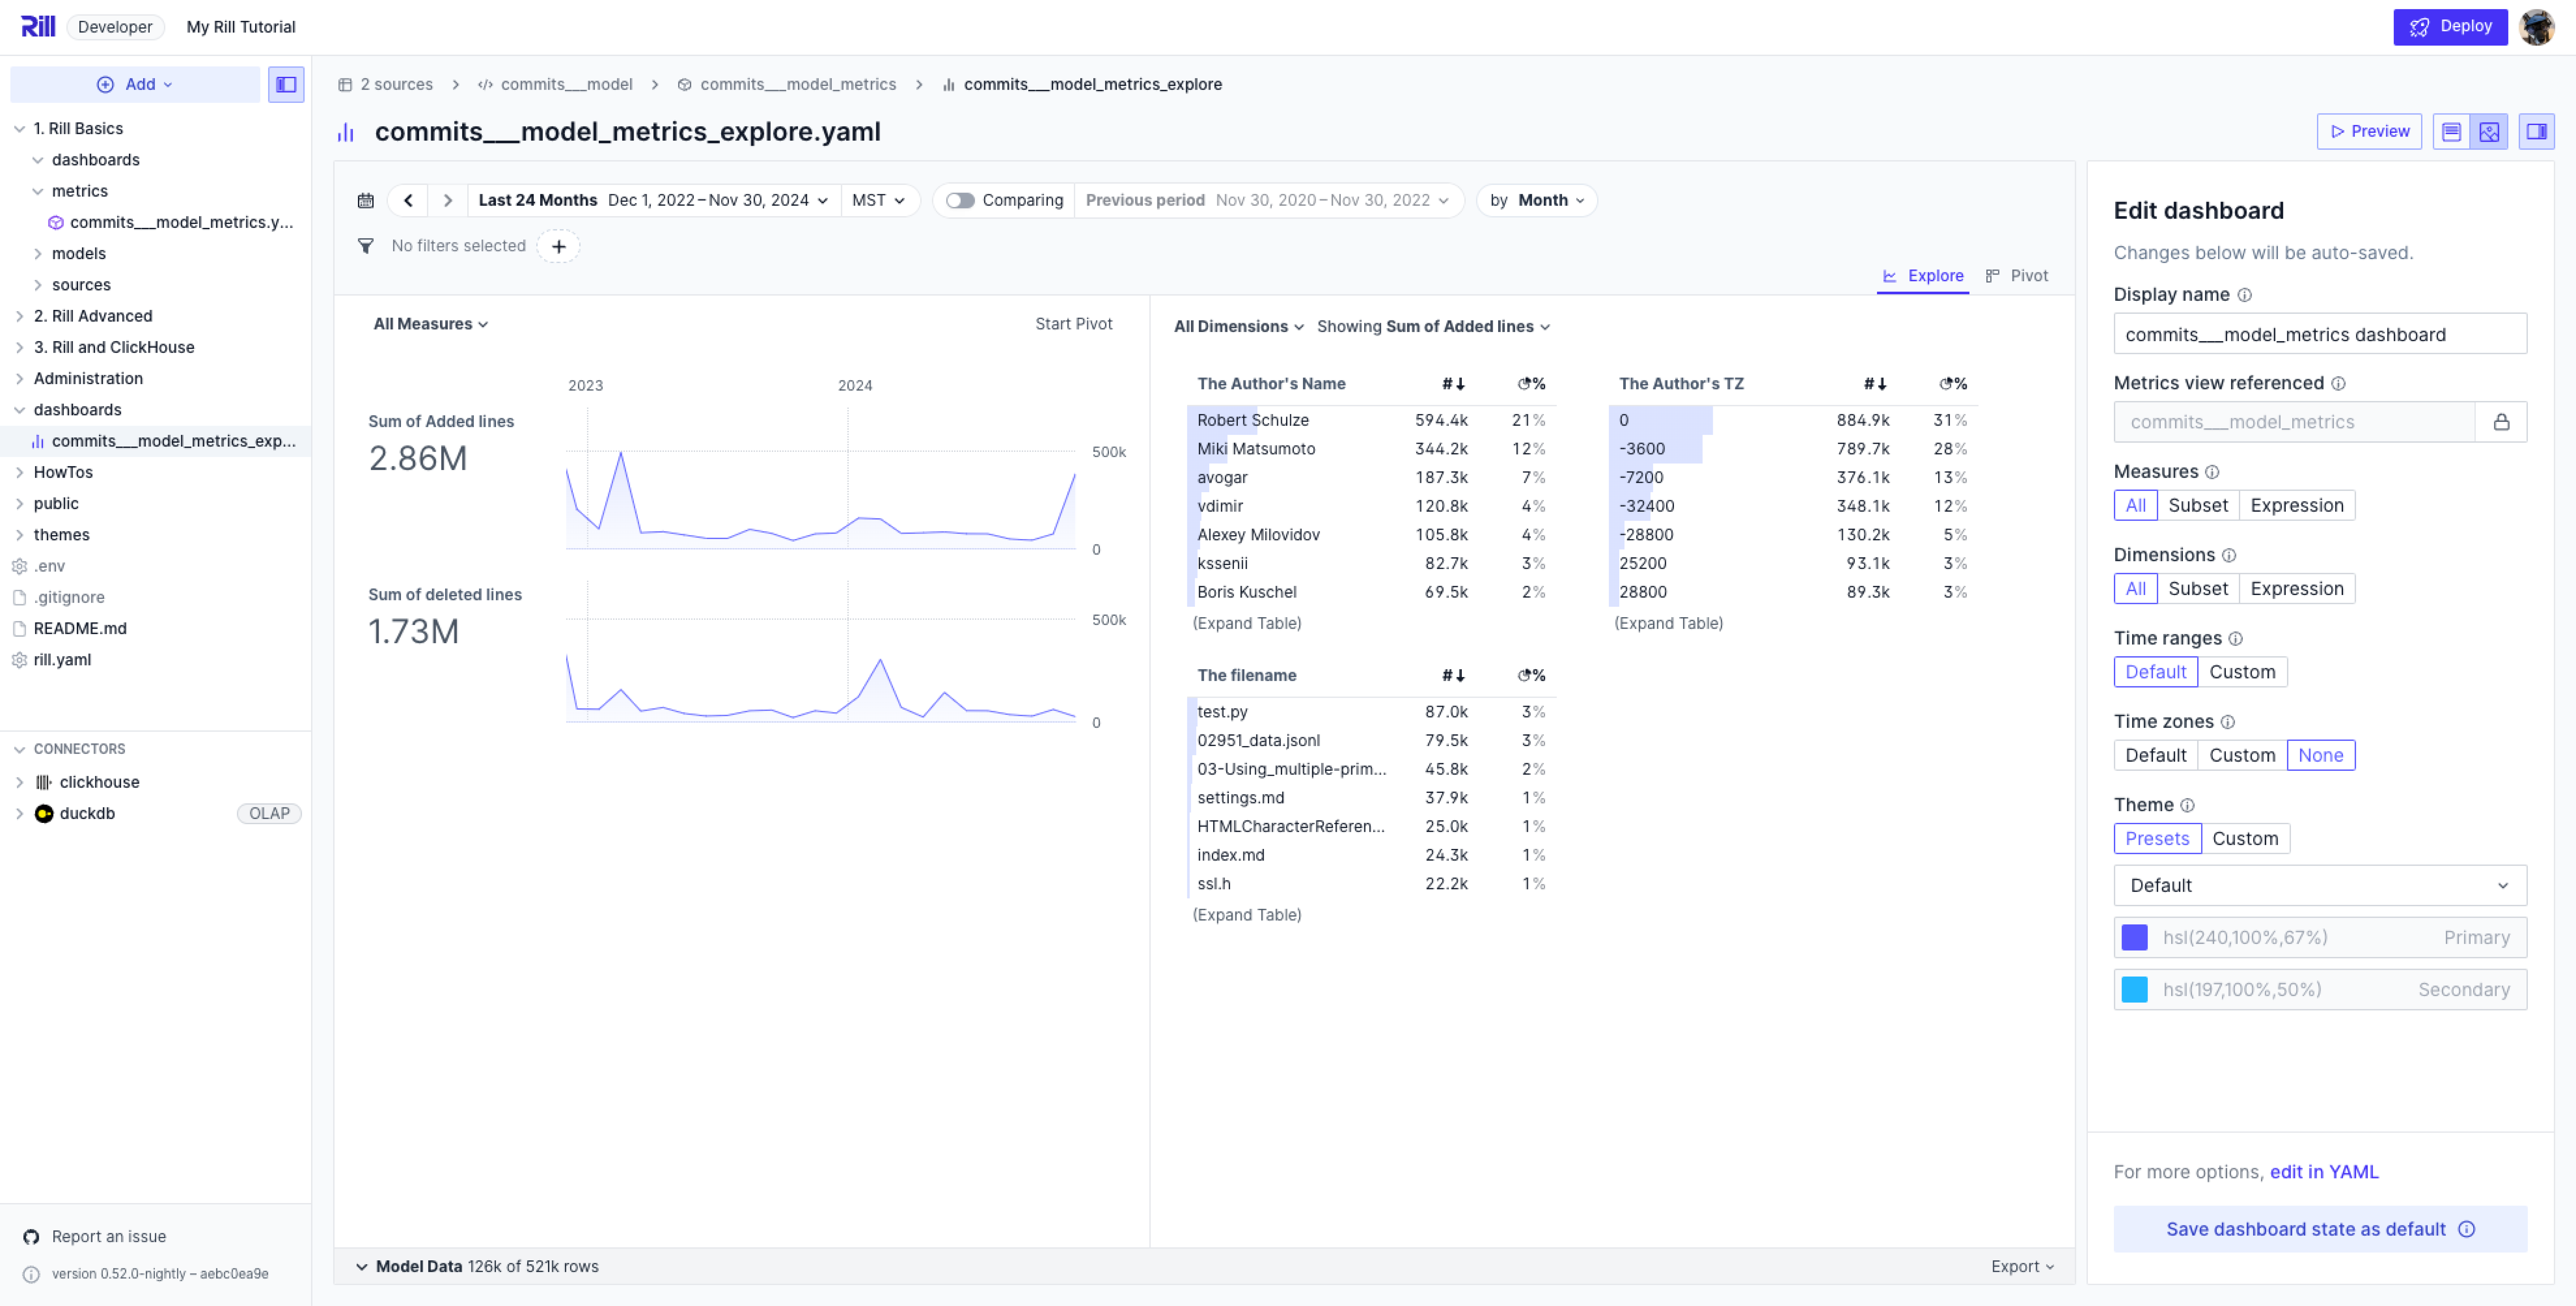
On the right panel, you are able to select measures, dimensions, time ranges, and various other components that control the view of your dashboard. In the main area, you will see a preview of what your dashboard will look like. You can also select the code view to make any needed changes and/or set more advanced settings as found in our explore dashboard YAML reference.
YAML
By default, the page will contain the basic parameters as seen below. You can add more advanced settings as required for your use case.
# Explore YAML
# Reference documentation: https://docs.rilldata.com/reference/project-files/explore-dashboards

type: explore

title: "commits_model_metrics dashboard"
metrics_view: commits_model_metrics

dimensions: '*'
measures: '*'
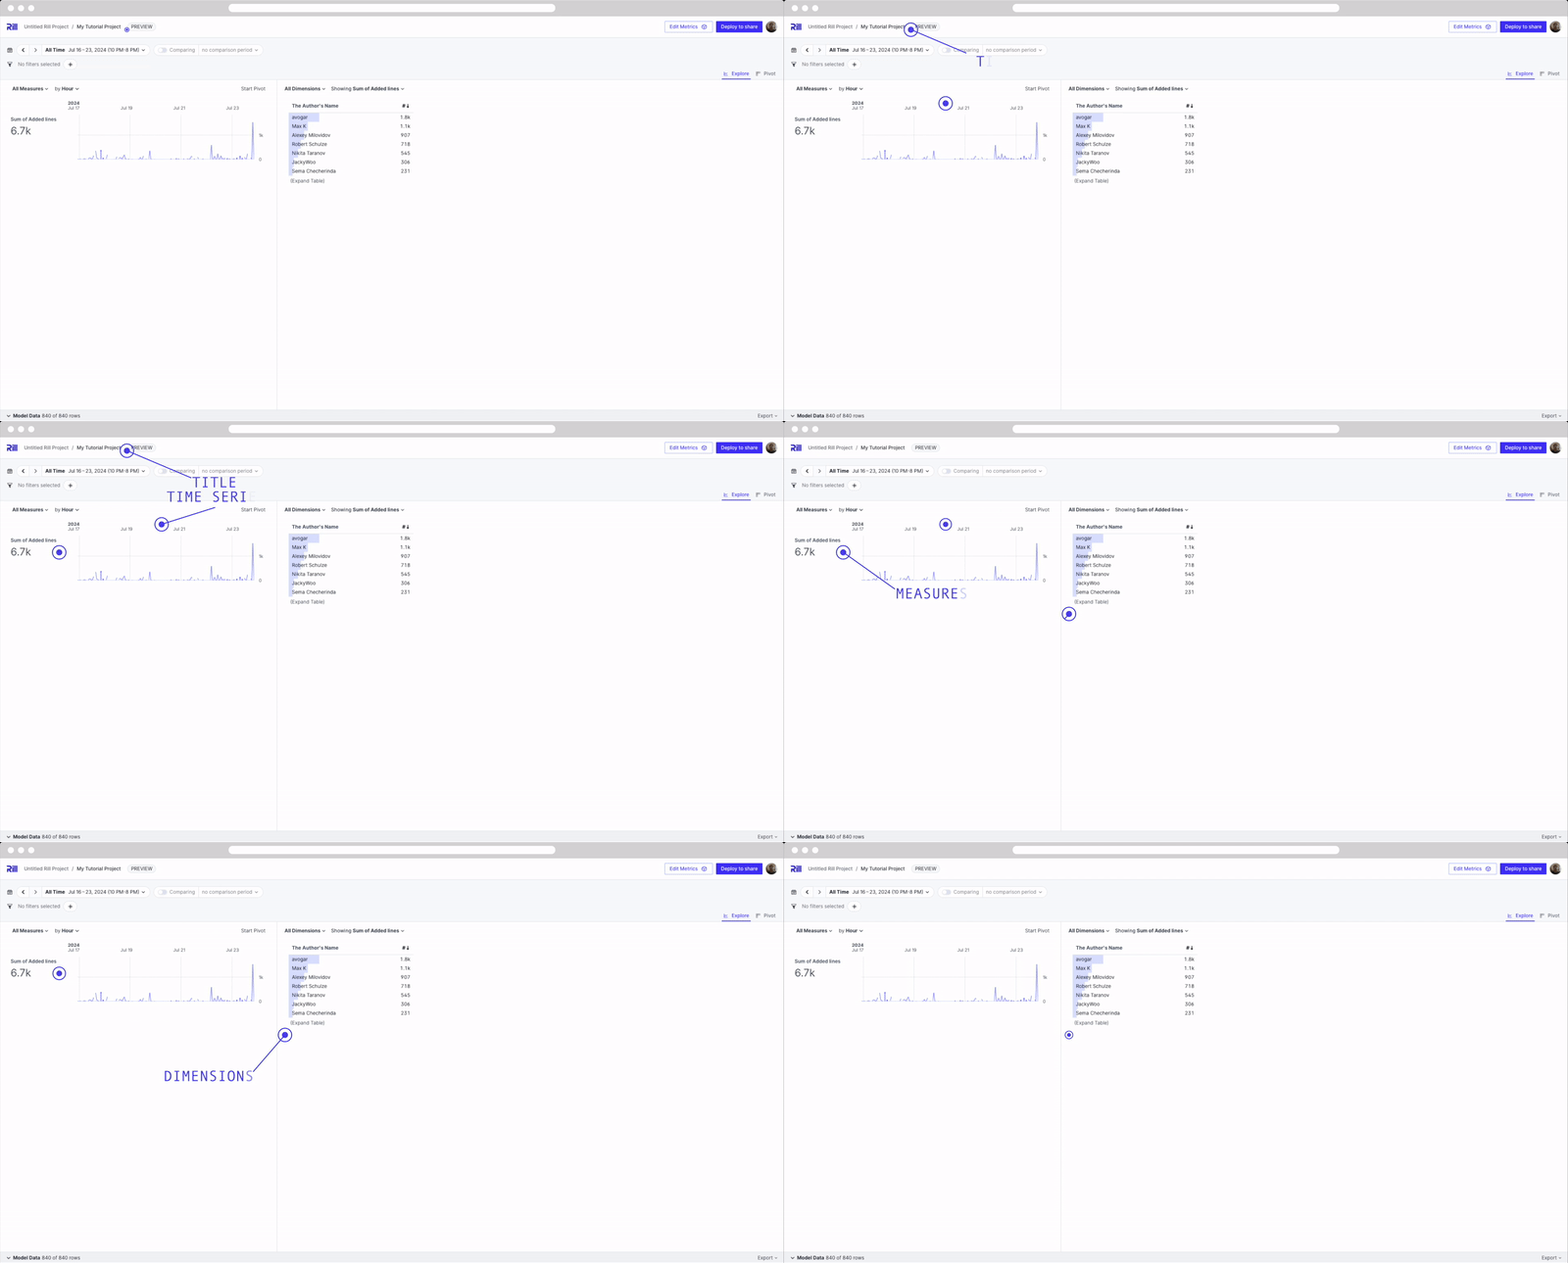
Explore Dashboard Components
For a quick summary of the different components of an explore dashboard and their respective parts in the dashboard UI:
Canvas Dashboard
Next, let's try to make a Canvas dashboard!
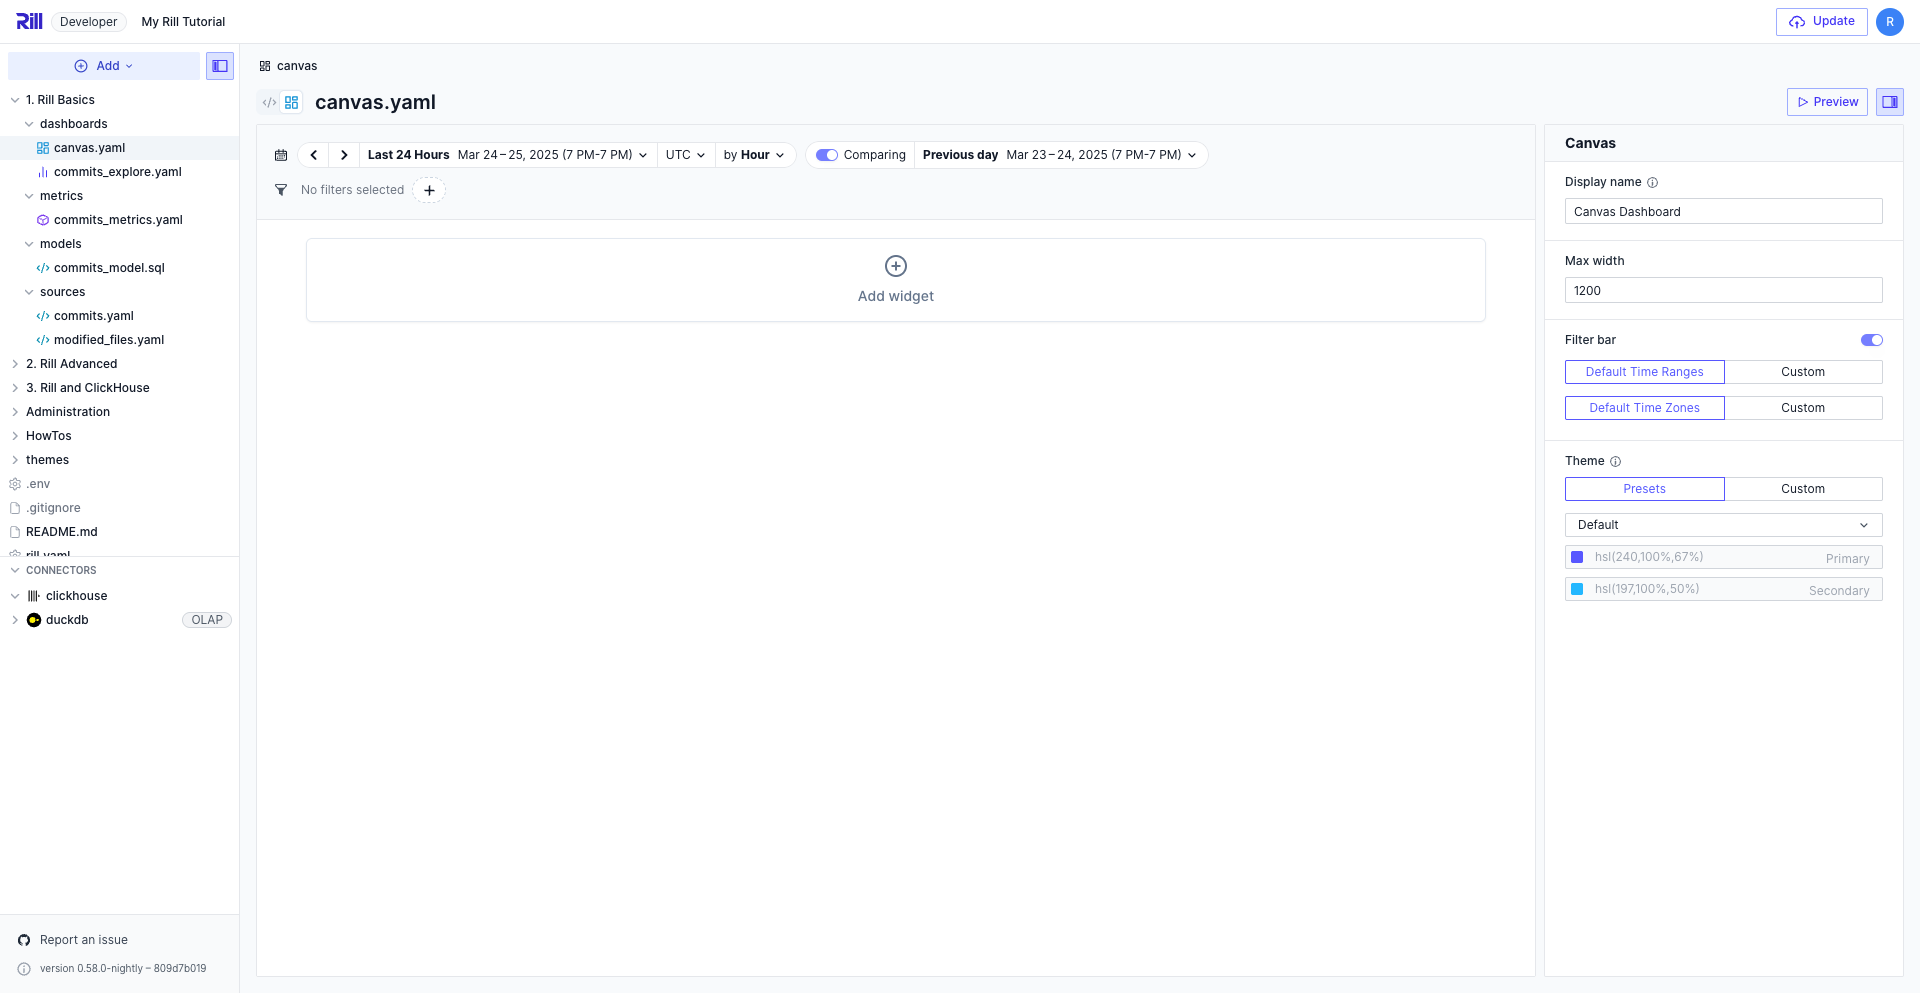
Select Add widget to build a component using our metrics view. The right-hand panel will display the different parameters that you can set per component.
Try to create the following:
- KPI with measures: [Sum of Added lines, Sum of deleted lines]
- Bar Chart: Added lines over Author Name.
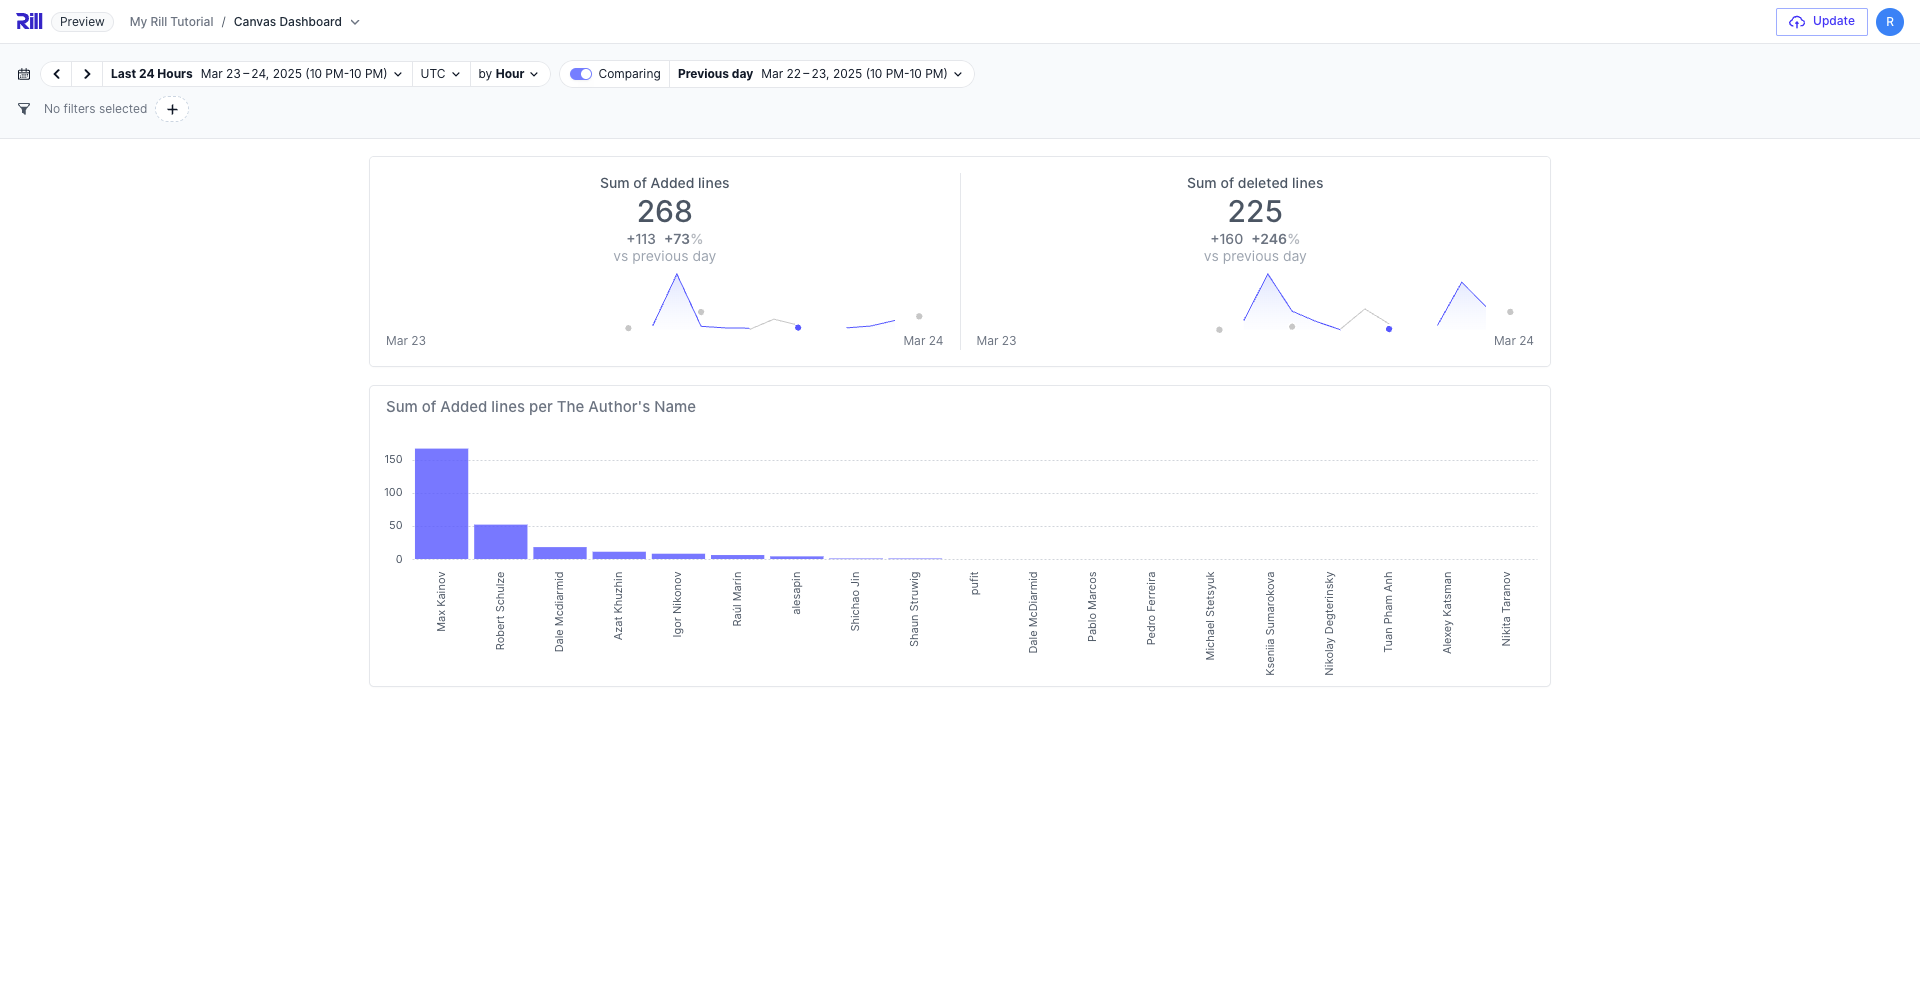
Once completed, select Preview. You should see something like the following image: