Time Dimension Detail
Overview
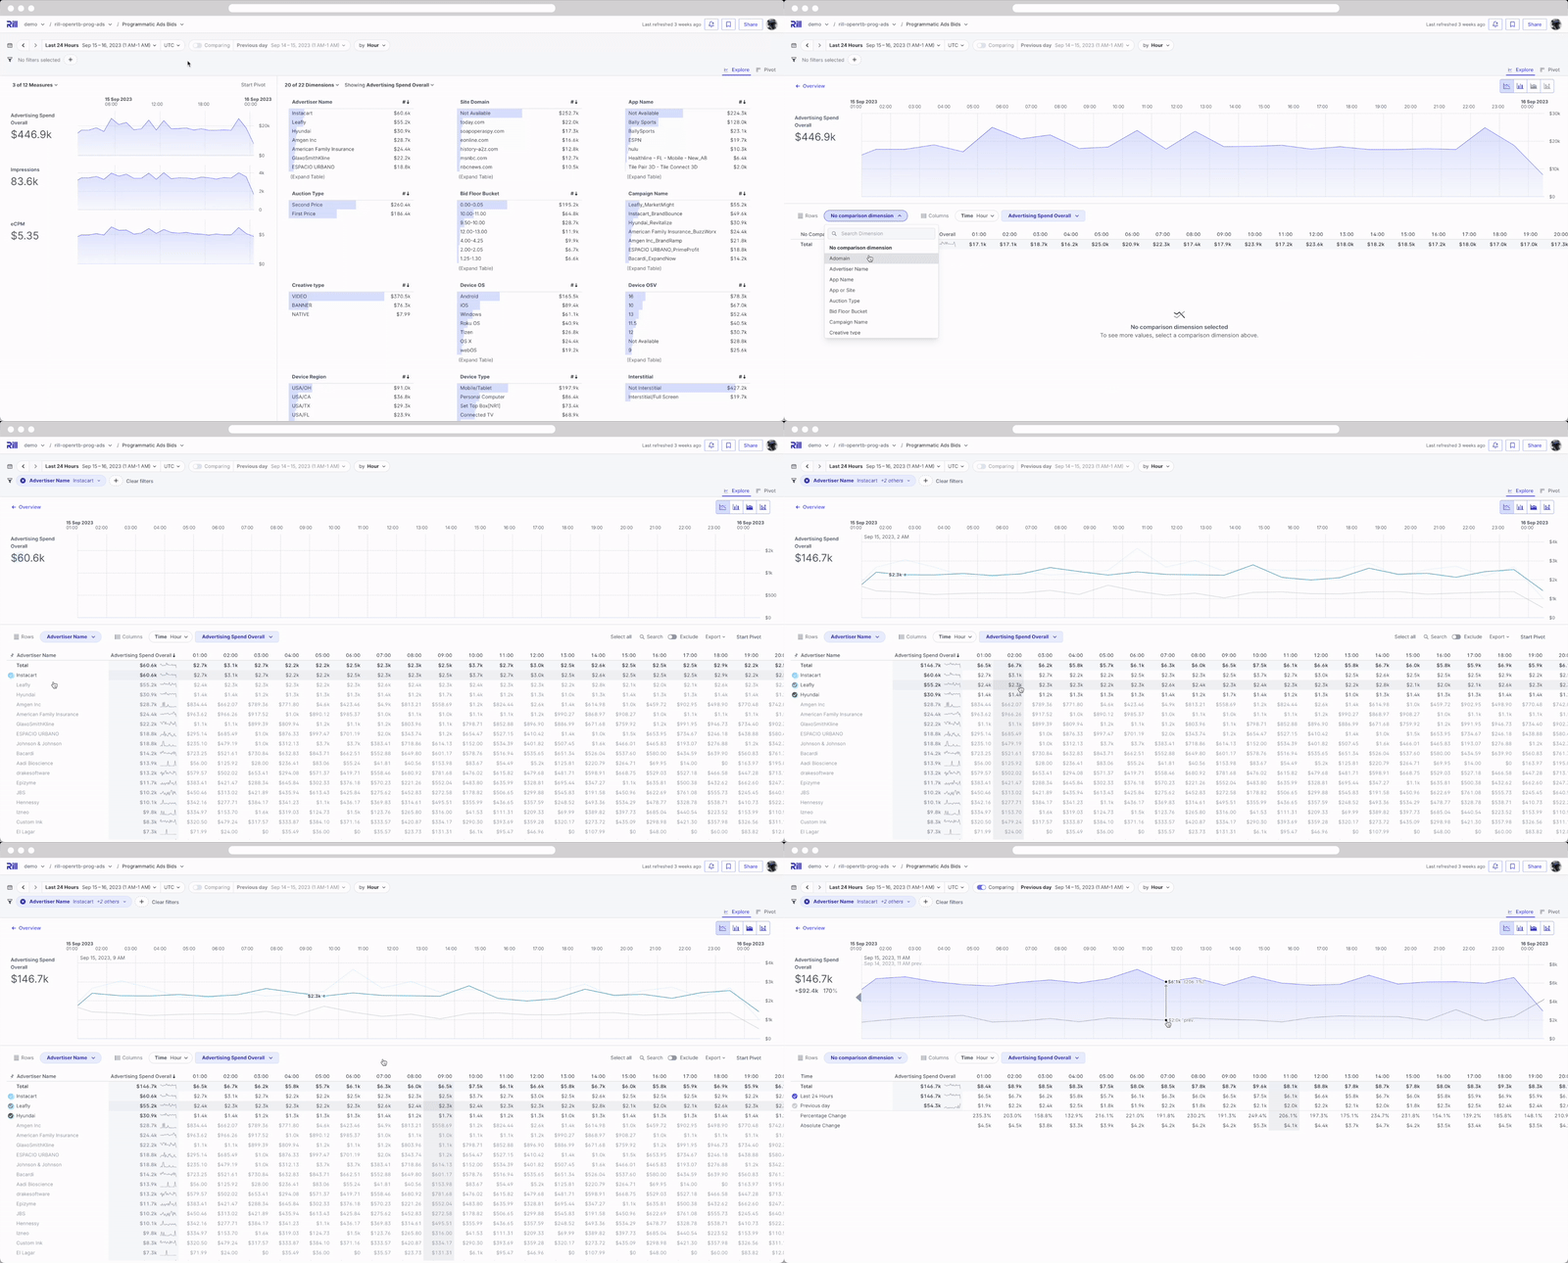
The Time Dimension Detail is a separate visualization accessed by clicking on any time series chart in Explore. Expanding the time series allows for more surface area to compare a larger number of dimensions trended over time. Additionally, you can create rapid pivot tables based on time across any dimension
Time Dimension Detail (TDD)
Within the TTD screen, you can apply all of the same filters and comparisons as Explore. Any filters applied will be carried into the TDD or will be carried out to Explore if you return to the main page on the top left.
Underneath the expanded time series chart, you will see two sets of dropdowns - one for Rows to change the comparison (this defaults to Time but can be changed to any dimension) and one for Columns (which can be used to cycle through all of your metrics). On the top right, you can also export the TDD pivot view for quick time series reporting.
Similar to the filters, the Search and Exclude options from the expanded Leadersboards are available on the top right of the TDD table. Lastly, you can also take the TDD table directly to the Pivot view for multi-dimensional analysis - more details on Pivot here.

The TDD screen will carry time dimension from your previous filters which many be more granular than needed (diplay too many columns). Change the Metric Trends by filter on the type right to switch to alernate ranges like days, weeks, etc.