Powering your Metrics View
Once you have finished building your model, you can create a metrics view to define measures and dimensions for your dashboard. The way you specify the underlying data source depends on your OLAP engine.
Choosing Your Data Source
Rill supports multiple OLAP engines, and the engine you're using determines which YAML property you'll use in your metrics view:
- Use
modelfor DuckDB and Rill-managed ClickHouse - Use
tablefor self-managed live connectors
DuckDB and Rill-Managed ClickHouse
For DuckDB (the default engine) and Rill-managed ClickHouse, use the model property to reference your data model:
# Metrics View YAML
# Reference documentation: https://docs.rilldata.com/reference/project-files/metrics-views

version: 1
type: metrics_view

model: example_model # Choose a model to underpin your metrics view
Self-Managed Live Connectors
For self-managed live connectors (like your own ClickHouse, MotherDuck, or Druid instance), use the table property and specify connection details:
# Metrics View YAML
# Reference documentation: https://docs.rilldata.com/reference/project-files/metrics-views

version: 1
type: metrics_view


database: default
connector: clickhouse
database_schema: billing
table: events # Choose a table to underpin your metrics view
For more information, refer to our metrics view YAML configuration.
Caching Query Results
By default, dashboard queries against metrics views backed by an external, self-managed connector (Snowflake, BigQuery, Databricks, your own ClickHouse, Druid, MotherDuck, Pinot, etc.) run live against the source on every interaction. For dashboards with many concurrent users or repeated drill-downs, this can drive up compute costs and add latency. Enable caching to reuse query results between users until the underlying data changes.
Caching is configured under the cache block on the metrics view. Because tables in live connectors are externally managed, caching is off by default — opt in by setting cache.enabled: true. By default, Rill invalidates the cache when the max timestamp of the metrics view's timeseries column changes. If you have a better indicator for when to invalidate the cache (for example, an ingest version column), use cache.key_sql to set a custom expression for the cache key.
type: metrics_view

connector: snowflake
database: MY_DATABASE
database_schema: MY_SCHEMA
table: MY_TABLE

timeseries: created_at
dimensions:
  - column: region
measures:
  - name: total_revenue
    expression: SUM(revenue)

cache:
  enabled: true
  key_sql: SELECT MAX(created_at) FROM MY_DATABASE.MY_SCHEMA.MY_TABLE
  key_ttl: 5m
Rill runs key_sql against the metrics view's connector (re-evaluated at most once per key_ttl) and uses the returned scalar value as the cache key (together with a hash of the incoming metrics query). When the value changes — for example because a new row landed — the cache is invalidated and the next query repopulates it.
Pros
- Lower source spend. Repeat queries (multiple users on the same dashboard, back-and-forth filtering) are served from Rill's in-memory cache instead of hitting the source. On BigQuery this means fewer bytes scanned; on Snowflake and Databricks it means less warehouse compute; on ClickHouse, Druid, and Pinot it means fewer broker queries.
- Faster cache hits. Cache lookups skip warehouse warm-up, query queue time, and per-query slot allocation. End-to-end latency depends on your Rill deployment topology.
- Tunable freshness.
key_sqlties cache invalidation to your data — typically a max event timestamp, an ingest version column, or a partition metadata lookup.key_ttlcontrols how often that signal is checked.
Cons
- Up to
key_ttlof staleness. Betweenkey_sqlevaluations, new data in the source will not appear on the dashboard. Matchkey_ttlto your tolerable staleness; setting it lower means more frequentkey_sqlqueries against the source. key_sqlitself runs on the source. Make sure it's a cheap query: aMAX()on a clustered/partitioned column on Snowflake or Databricks, or a metadata lookup againstINFORMATION_SCHEMA.PARTITIONSon BigQuery. AMAX()without a partition filter on BigQuery scans the whole table on every refresh.- Cache is split per security context. Row-level security policies and user attributes are part of the cache key, so a dashboard that filters per user does not share cached results across users.
- Memory usage. Cached results live in Rill's in-memory cache; very high-cardinality dashboards with many distinct queries will evict older entries.
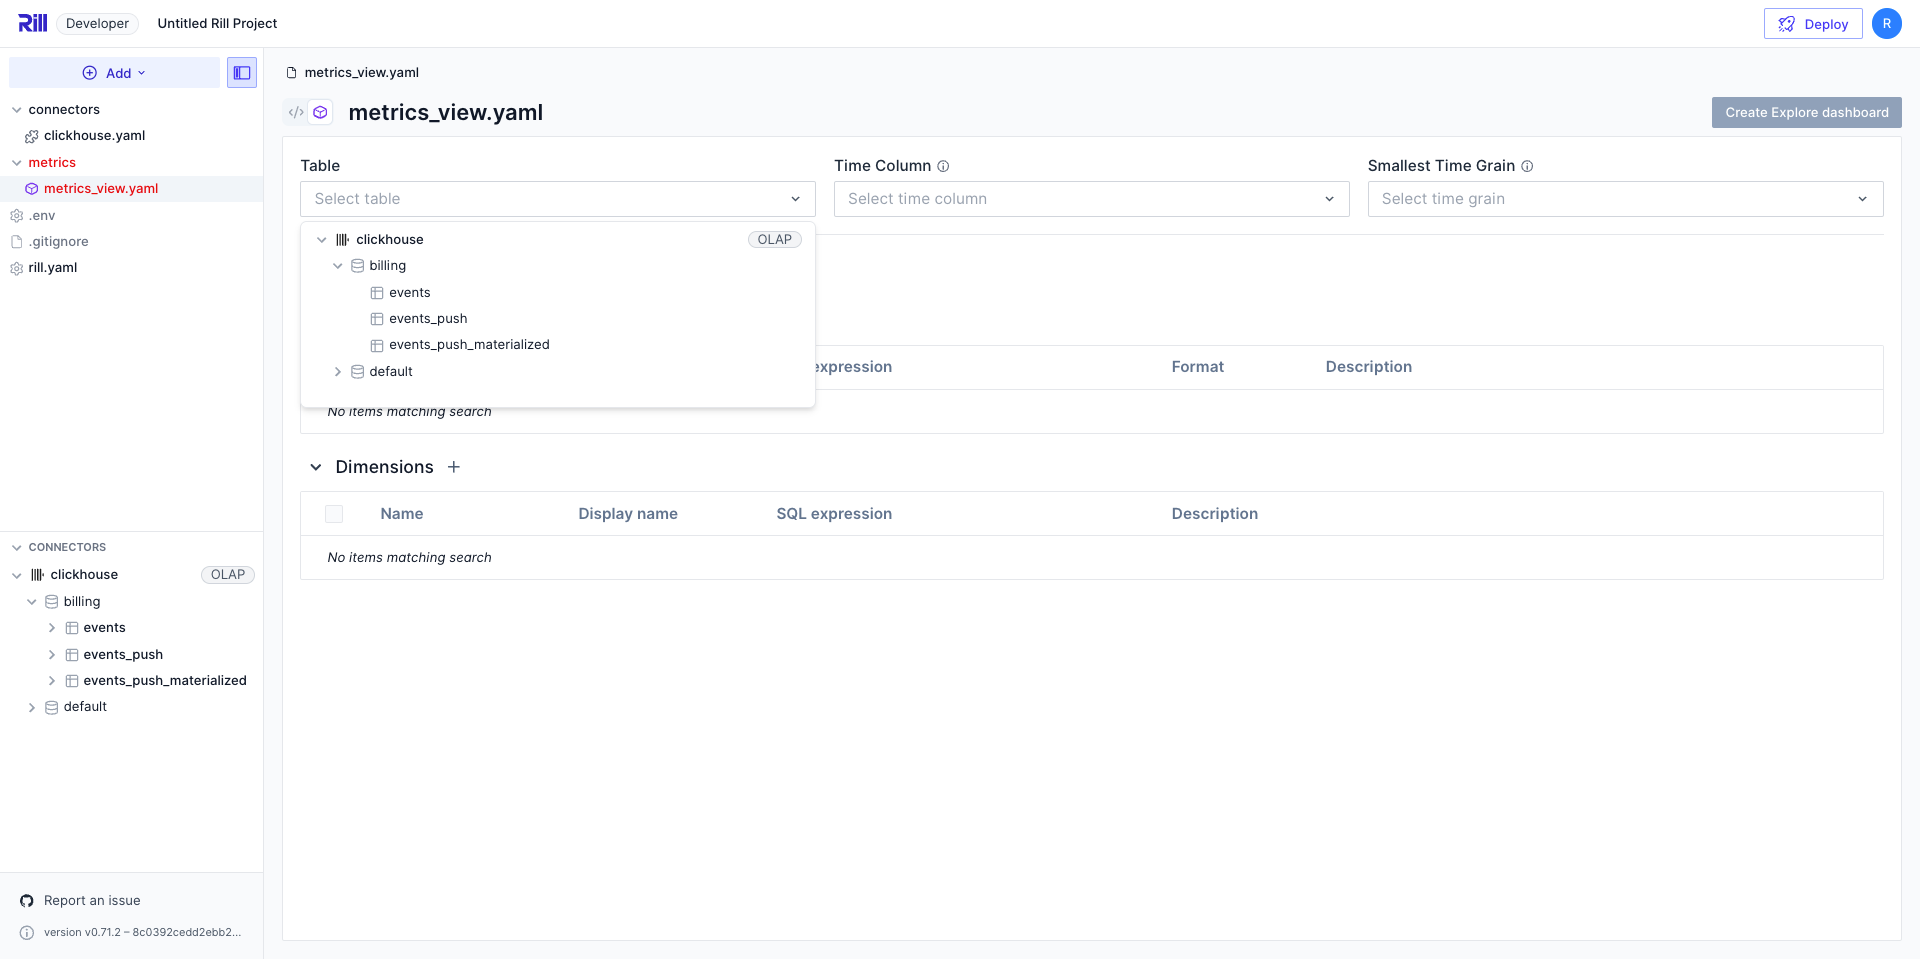
Visual Metrics Editor
If you're using the UI to select your table, choosing a live connector will automatically configure the YAML with the correct table, connector, and database_schema fields.