4. Create the Metrics View
What is a Metrics View?
A metrics view is a layer in which you can create and define your measures and dimensions. Think of it as the layer that takes all of your raw data and makes sense of it. In this layer, you can define, for example, what Net Revenue is defined as using basic to advanced arithmetic functions available in DuckDB. You also define what dimensions to use to slice-and-dice your data in the Explore Dashboard. If using Canvas dashboards, you can view multiple metrics views in a single page!
Let's create a metrics view!
Now that the data is ready in your model file, we can create a metrics view. There are two ways to do so:
- Generate metrics with AI
- Start Simple using the +Add, Metrics
How does Generate metrics with AI work?
We send a set of YAML files along with some contextto OpenAI to suggest the dimensions, measures, and various other key pairs for your dashboard.
Let's go ahead and create a simple metrics layer via the UI and build onto it.

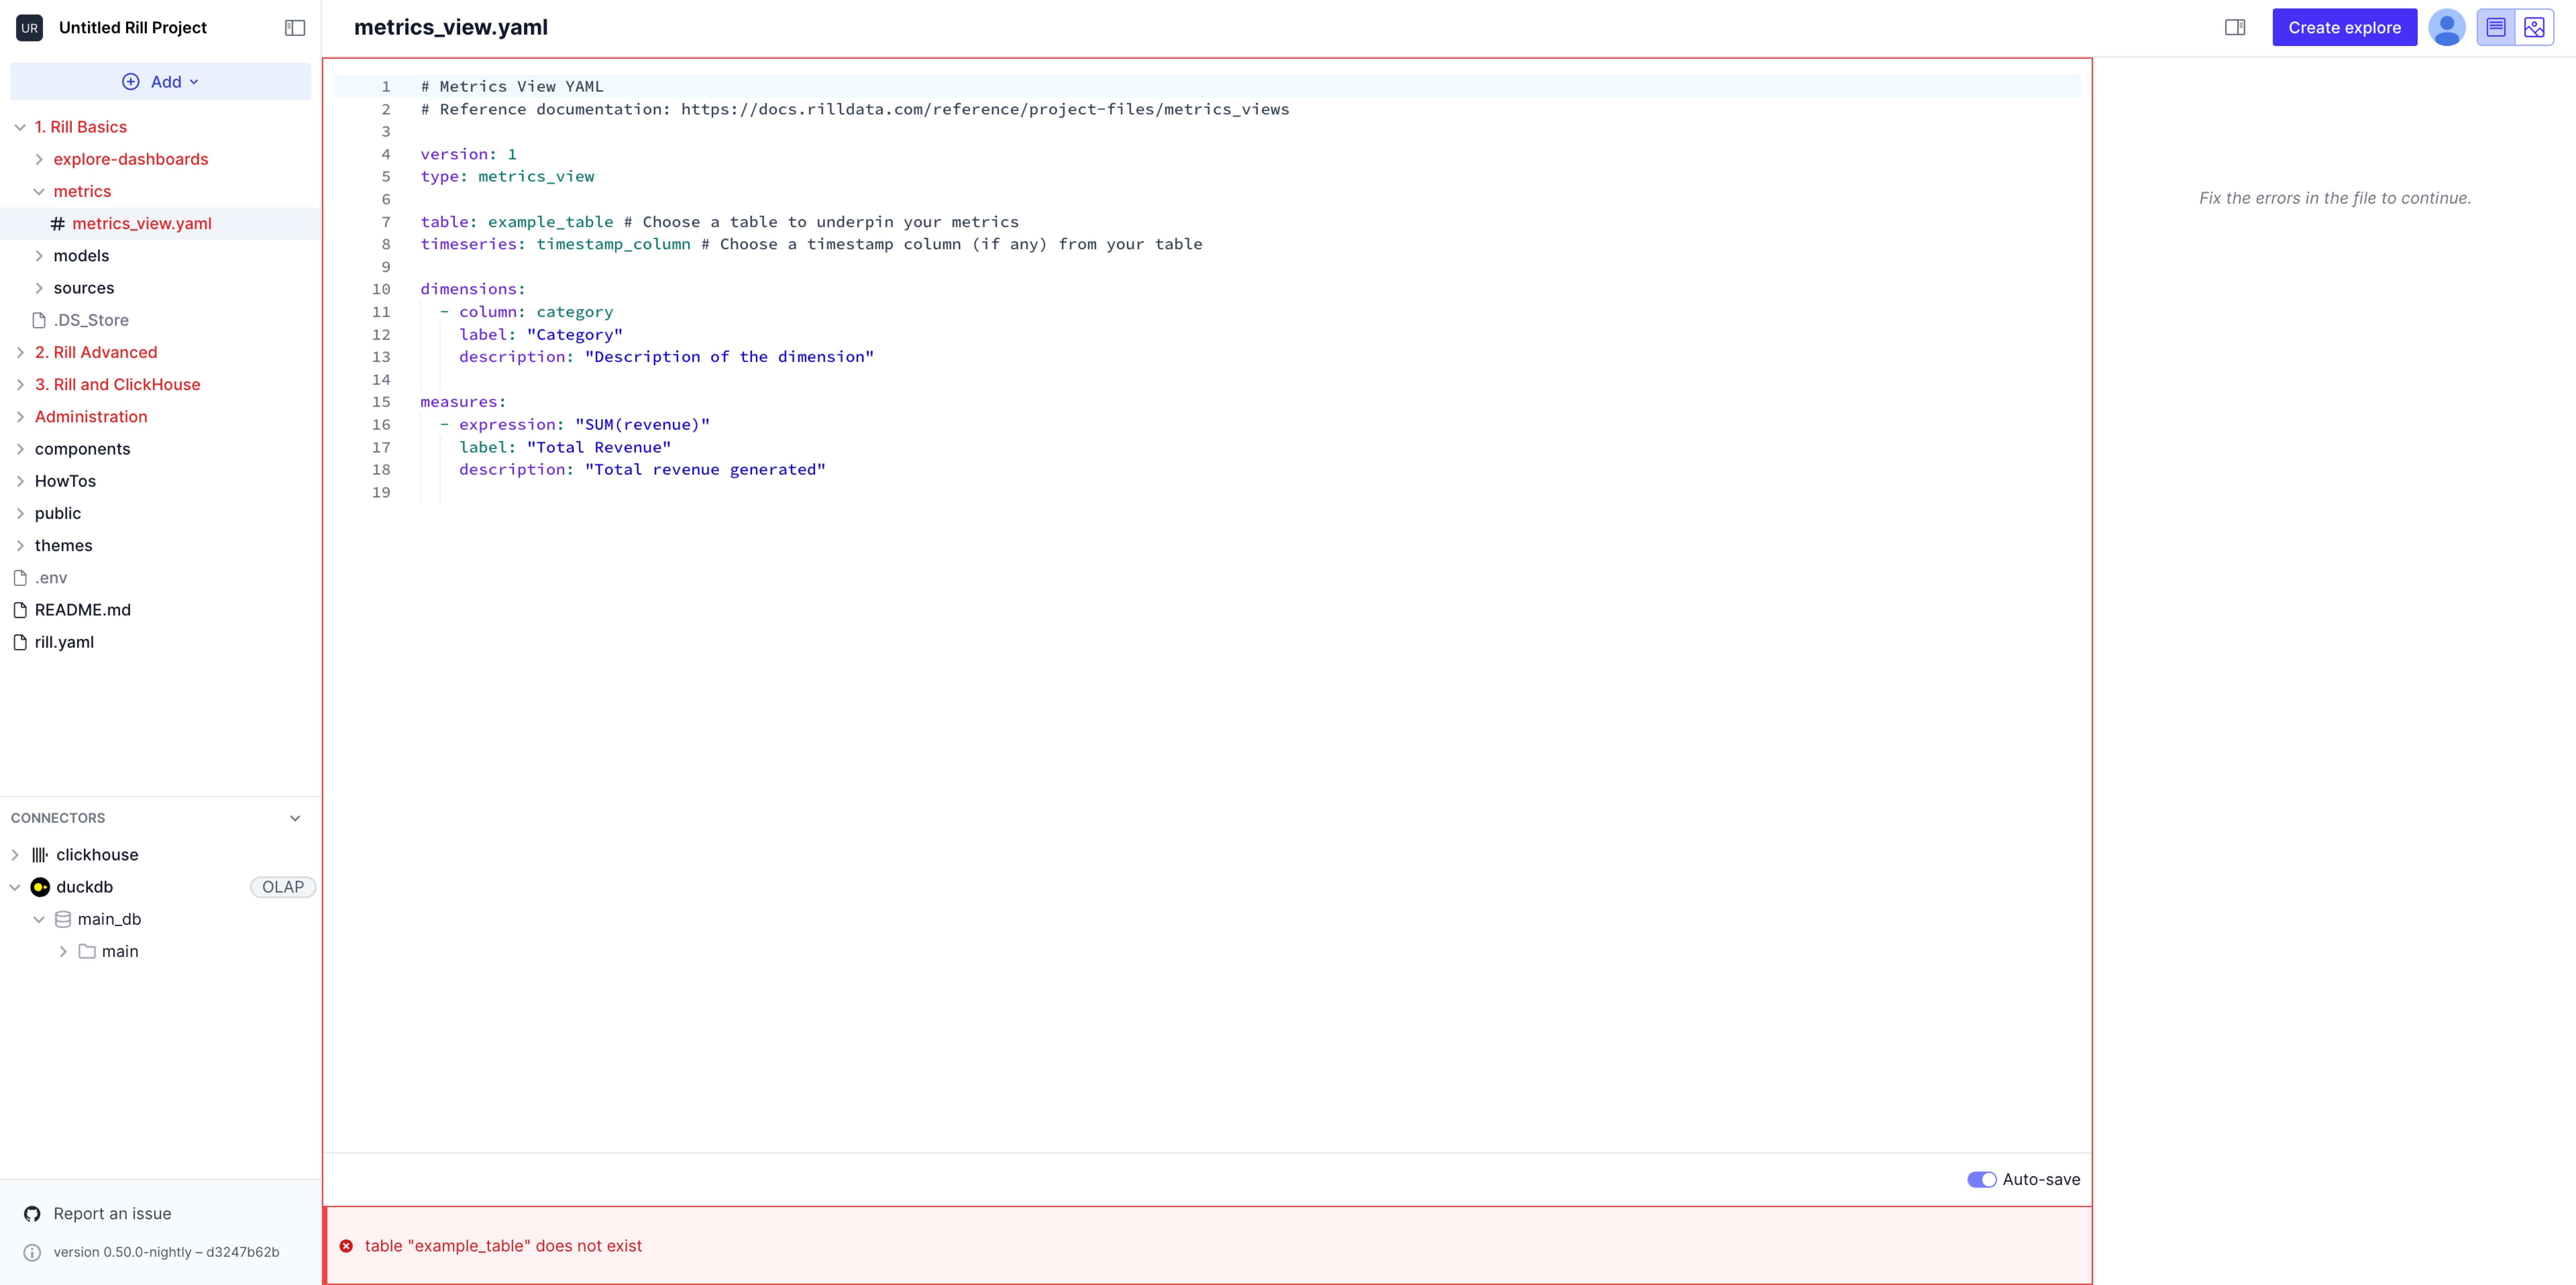
As you can see, the default dashboard YAML is as follows:
# Metrics View YAML
# Reference documentation: https://docs.rilldata.com/reference/project-files/metrics_views

version: 1
type: metrics_view

table: example_table # Choose a table to underpin your metrics
timeseries: timestamp_column # Choose a timestamp column (if any) from your table

dimensions:
  - column: category
    label: "Category"
    description: "Description of the dimension"

measures:
  - expression: "SUM(revenue)"
    label: "Total Revenue"
    description: "Total revenue generated"
For now, you'll see a red box around the UI and the preview button grayed out. This indicates something is wrong with the YAML.
Fixing the Metrics View
From here, we have two options! Starting from version 0.50, we have introduced the visual-metric-editor, in the top right corner, you can select whether you want to modify the YAML directly or use a UI tool.
Via the Visual Metrics Editor
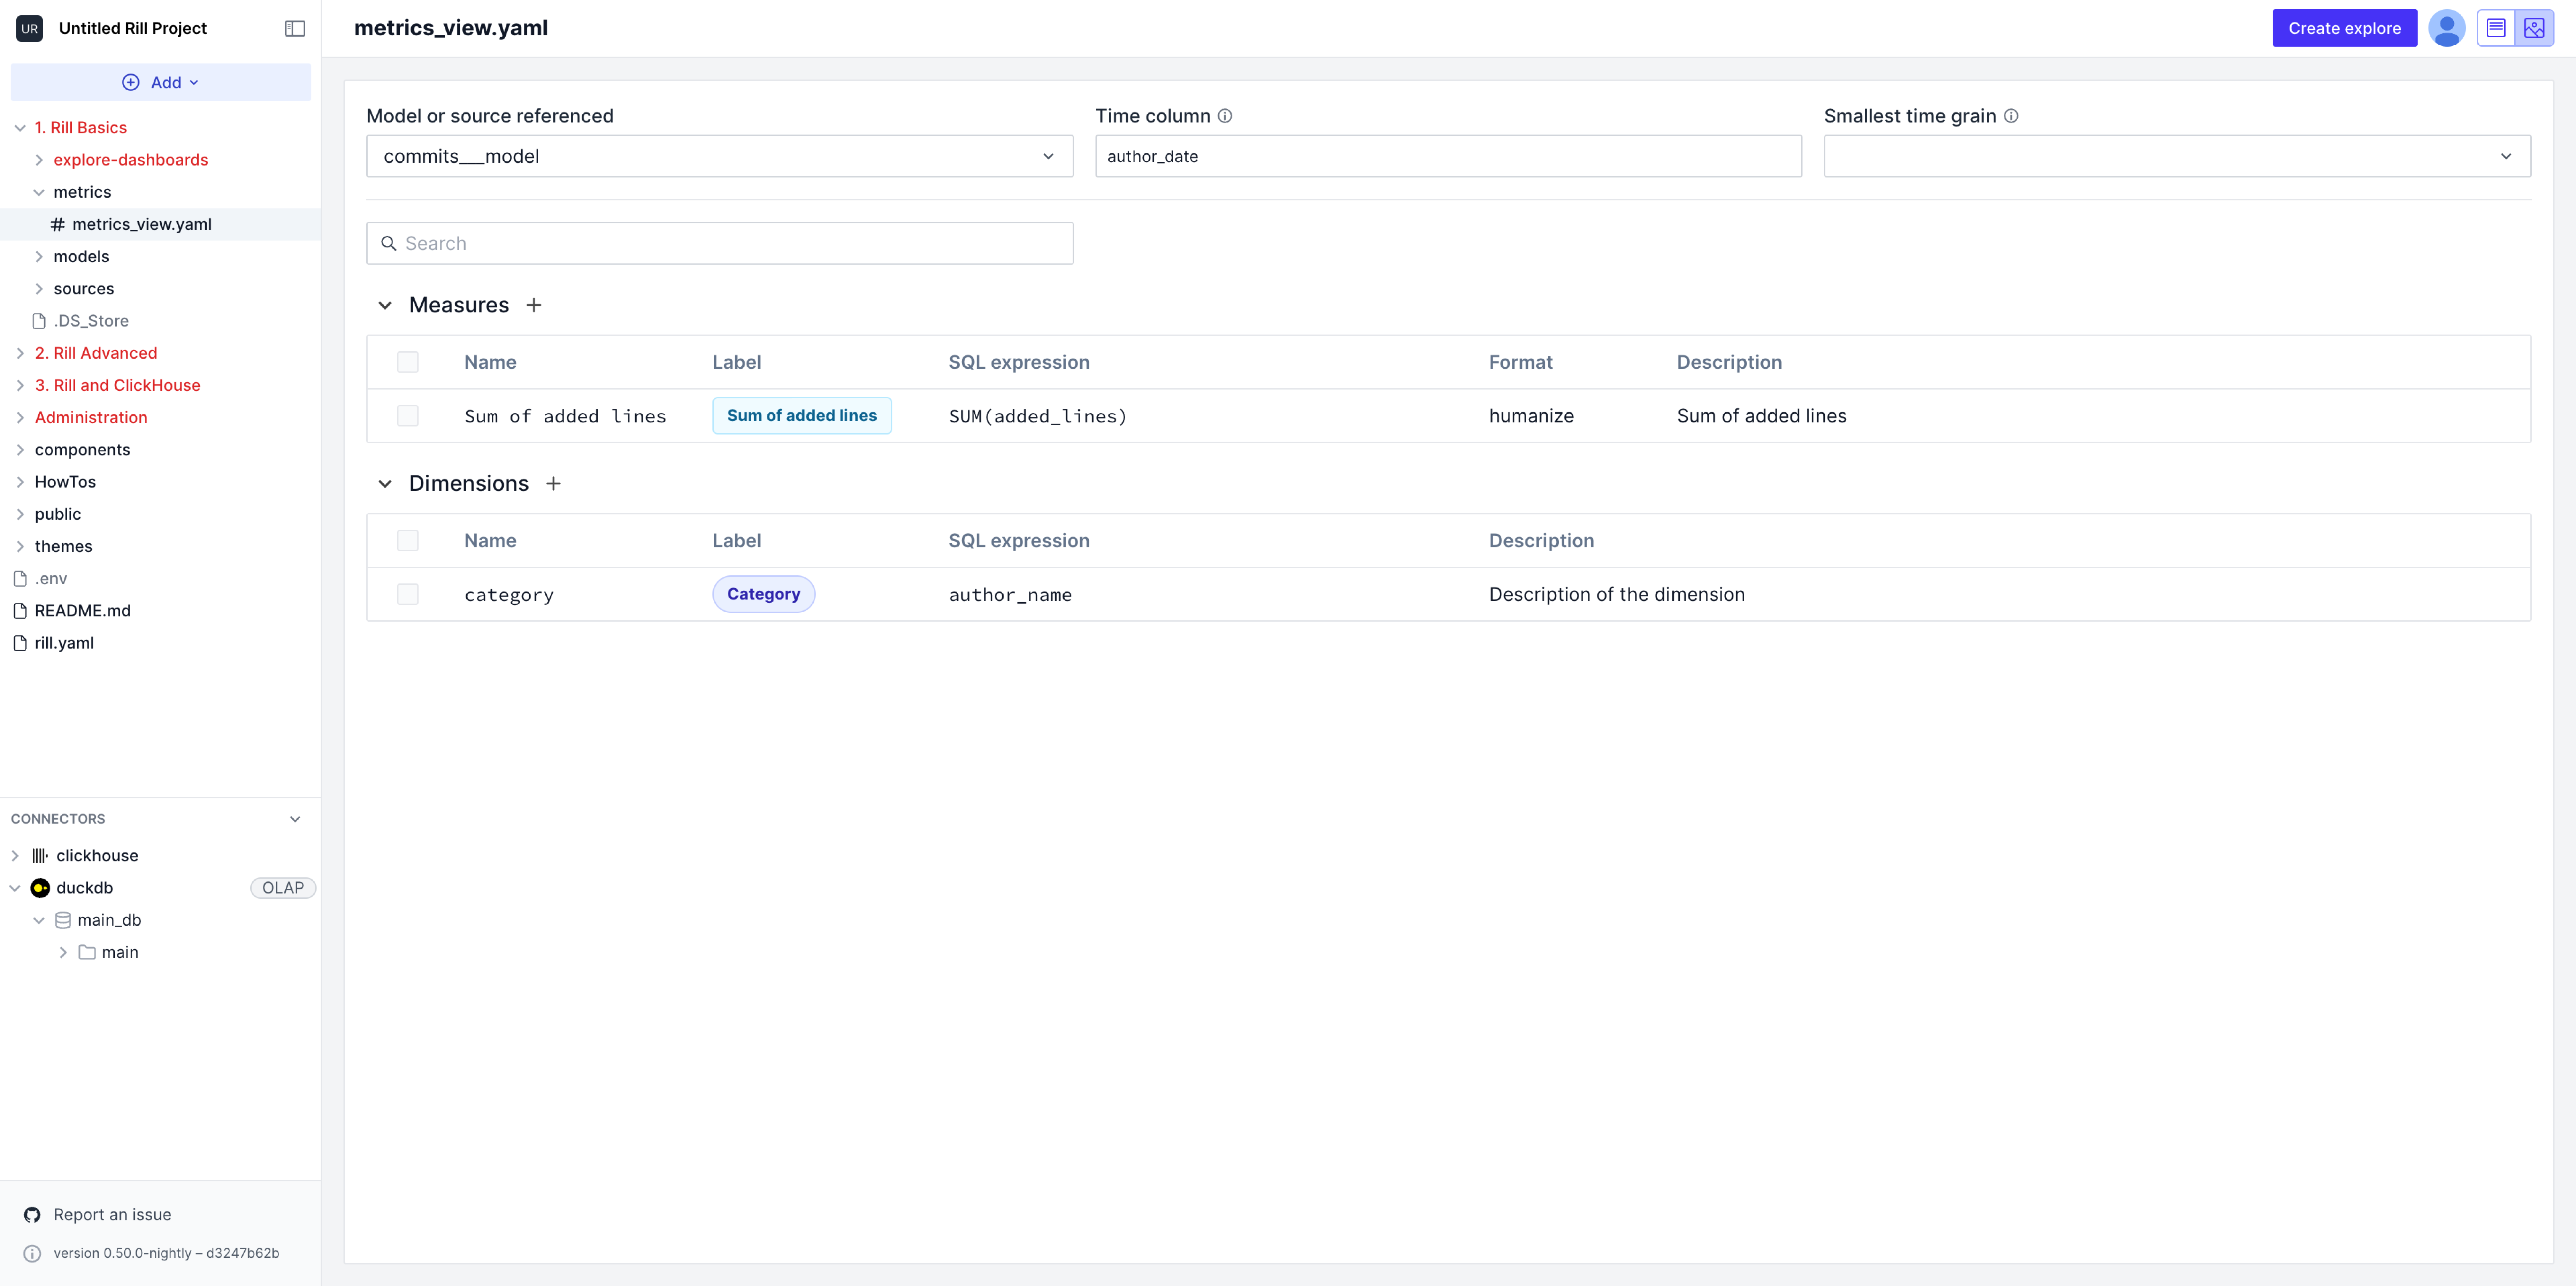
In the top right of the UI, select the viz button to navigate to the visual metrics editor. The below is an example of a completed visual metrics editor. We will make some modifcations to our current file to build something similar.
We can go ahead and change the following components as directed in the UI:
model: commits_modeltime column: author_datemeasures: sum(added_lines)dimensions: author_name

Once finished, the red border will disappear and your explore dashboard is ready to be created. If you need further information on each component see the next section, via the YAML.
Via the YAML
Let's go over each component and what they are in order to better understand the metrics view and how to fix the dashboard.
Type
version: 1
type: metrics_view
The type is a Rill required key pair as it indicates to Rill what type of file this is. Whether a source, metrics_vew, connector, etc. We can keep this as is.
Underlying Table
table: commits_model # Note that this has 3 "_"!
The underlying table can be defined here, let's change it to commits_model.
Time series
timeseries: author_date # Select an actual timestamp column (if any) from your table
The time-series column is a date type column within your table. Let's set this to author_date.
Dimensions
dimensions:
  - column: author_name #the column name in the table
    label: "The Author's Name" #A label
    description: "The name of the author of the commit" #A description, displayed when hovered over dimension
Dimensions are used for exploring segments and filtering the dashboard. Each dimension hve a set of required key pairs. For the column, you will need to set it to a column from your model or table, assign it a label (this is how it's labeled in the dashboard) and provide a description. The description will be displayed when hovering over, and can provide more context.
Our first dimension wil be the author's name. Let's go ahead and make the changes above.
Measures
measures:
  - expression: "SUM(added_lines)"
    label: "Sum of Added lines"
    description: "The aggregate sum of added_lines column"
Measure are the numeric aggreagtes of columns from your data model. These function will use DuckDB SQL aggregation functions and expressions. Similar to dimensions, you will need to create an expression based on the column of your underlying model or table.
Our first measure will be: SUM(added_lines).
Adding more Functionality
Let's add further dimensions and measure to the metrics layer and see the changes to the explore dashboard.
Dimensions
From our dataset, we can add more dimensions to allow more filtering and exploration of the measures we will create.
Add the following dimensions, with title and description.
- author_name
- author_timezone
- filename
Measures
We can definitely create better aggregations for some more meaningful data based on these commits.
- sum(added_lines)
- sum(deleted_lines)
You may need to reference the metrics view YAML reference guide to figure out the above. Your final output should look something like this!
Working Metrics View YAML
# Metrics View YAML
# Reference documentation: https://docs.rilldata.com/reference/project-files/metrics_views

version: 1
type: metrics_view

table: commits_model

timeseries: author_date # Select an actual timestamp column (if any) from your table

dimensions:
- column: author_name
  name: author_name
  label: The Author's Name
  description: The name of the author of the commit

- column: author_timezone
  label: "The Author's TZ"
  description: "The Author's Timezone"

- column: filename
  label: "The filename"
  description: "The name of the modified filename"

measures:
- expression: SUM(added_lines)
  name: added_lines
  label: Sum of Added lines
  format_preset: humanize
  description: The aggregate sum of added_lines column.
  valid_percent_of_total: true

- expression: "SUM(deleted_lines)"
  label: "Sum of deleted lines"
  description: "The aggregate sum of deleted_lines column."
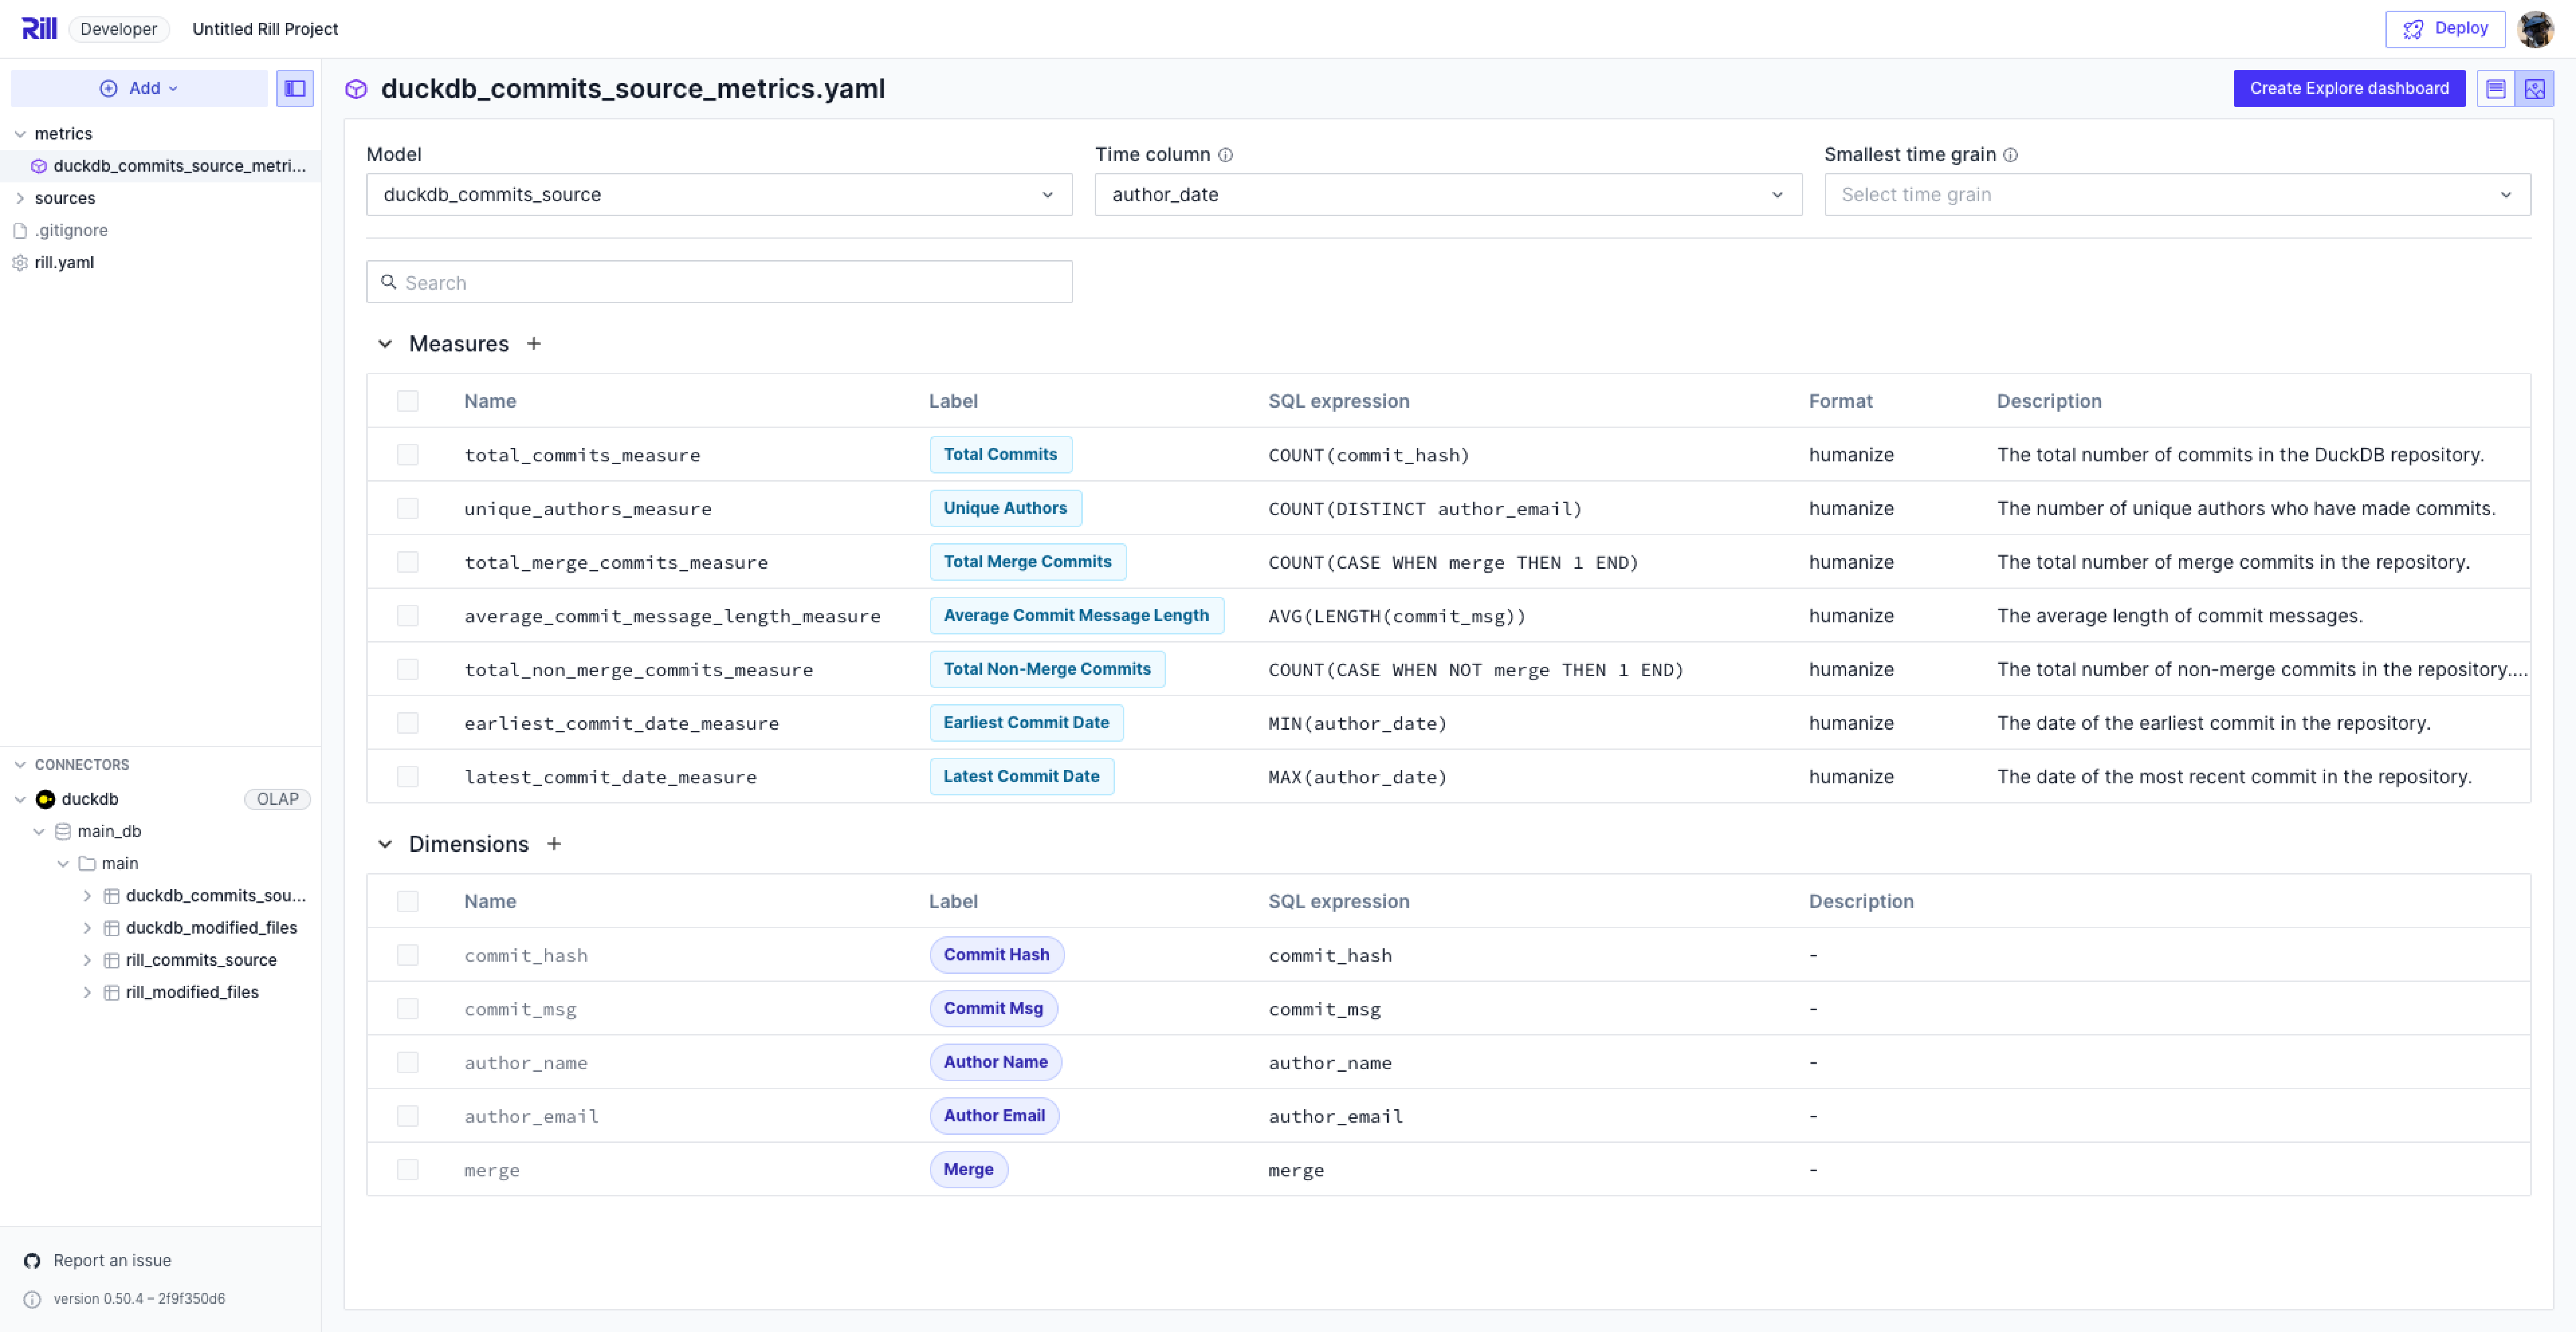
Completed visual metrics editor
If you decide to build out the metrics view via the UI, it should look something like below!
