Using Time Series Filters
Prefer video? Check out our YouTube playlist for a quick start!
Overview
Time is one of the most powerful dimensions in analytics, and Rill dashboards are designed to help you make the most of your time series data. The time filter is a central tool for exploring trends, identifying anomalies, and comparing performance across different periods. Whether you’re analyzing daily sales, monitoring system metrics, or tracking campaign results, understanding how to use time filters will help you unlock deeper insights and make more informed decisions.

Comparison Time Ranges
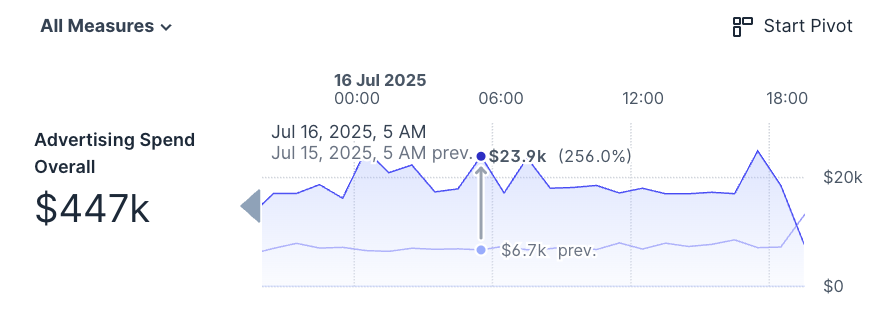
Comparing performance across different periods is a key part of time series analysis. Rill makes this easy with comparison time ranges:
- Enable comparison: Turn on comparison mode to see how your current period stacks up against a previous one (e.g., this week vs. last week, this month vs. last month).
- Visual cues: Rill highlights changes, trends, and deltas, making it easy to spot improvements or areas needing attention.
as of latest
At the right of the time filter, you’ll see as of lastest. This indicates the last time the data has been reloaded. If you're noticing the "Past 7 Days" is not indicating the correct dates, take a look to see when the last time the data successfully reloaded. When hovering over the text, you'll see the following.
- Earliest: The first available timestamp in your dataset.
- Latest: The most recent timestamp in your dataset (should match “as of”).
- Now: The current system time.
Why it matters:
This helps you understand how fresh your data is, when it was last updated, and whether you’re looking at real-time or historical information.
Example:
- Earliest: Mon, Jun 30, 2025, 6:00 PM
- Latest: Wed, Jul 16, 2025, 5:00 PM
- Now: Wed, Jul 16, 2025, 8:44 PM
Default Time Ranges
Rill provides a set of default time ranges that appear in the time filter dropdown. These are designed to cover the most common analysis periods, such as:
- Today, Yesterday
- Last 7 days, Last 30 days
- Past 3 Months
- Year to date
You can customize these ranges in your explore settings or rill.yaml file to better fit your organization’s needs. For example, you might add a “Last 90 days”, P90D, or remove less relevant ones.
time_ranges:
  - PT6H
  - PT24H
  - P7D
  - P14D
  - P4W
  - P3M
  - P12M
  - rill-TD
  - rill-WTD
  - rill-MTD
  - rill-QTD
  - rill-YTD
  - rill-PDC
  - rill-PWC
  - rill-PMC
  - rill-PQC
  - rill-PYC
Each time range is defined using ISO 8601 duration syntax, or you can use Rill’s ISO 8601 extensions for more flexibility. This allows you to precisely control the periods available to users.
Time Zones
Time zones play a crucial role in time series analysis, especially for global teams or data collected across multiple regions. In Rill, you can configure the default time zones in your explore settings or rill.yaml, ensuring that dashboards reflect the correct local time for your users.
- Default time zones: Set a default for your organization or project.
- User selection: Users can override the default and select any time zone from a searchable list, making it easy to view data in their preferred context.
time_zones:
  - UTC
  - America/Los_Angeles
  - America/Chicago
  - America/New_York
  - Europe/London
  - Europe/Paris
  - Asia/Jerusalem
  - Europe/Moscow
  - Asia/Kolkata
  - Asia/Shanghai
  - Asia/Tokyo
  - Australia/Sydney
Users reporting different numbers or claiming the data is wrong? Double check that both users are looking at the same time zone! Rill saves a user's last state and if they were viewing a different time zone at some point, it might be saved to that time zone.
Time Grain
The time grain determines the level of detail shown in your time series charts and tables—such as hour, day, week, or month. This is controlled by the smallest_time_grain setting in your metrics view configuration.
- Fine grain (e.g., hour): Useful for short time ranges or when you need to see detailed patterns, such as hourly website traffic or system metrics.
- Coarse grain (e.g., week, month): Better for long-term trends or when you want to smooth out short-term fluctuations.
Rill automatically adjusts the available grains based on the selected time range. For example, if you select a year-long period, hourly data may be hidden to keep charts readable and performant.