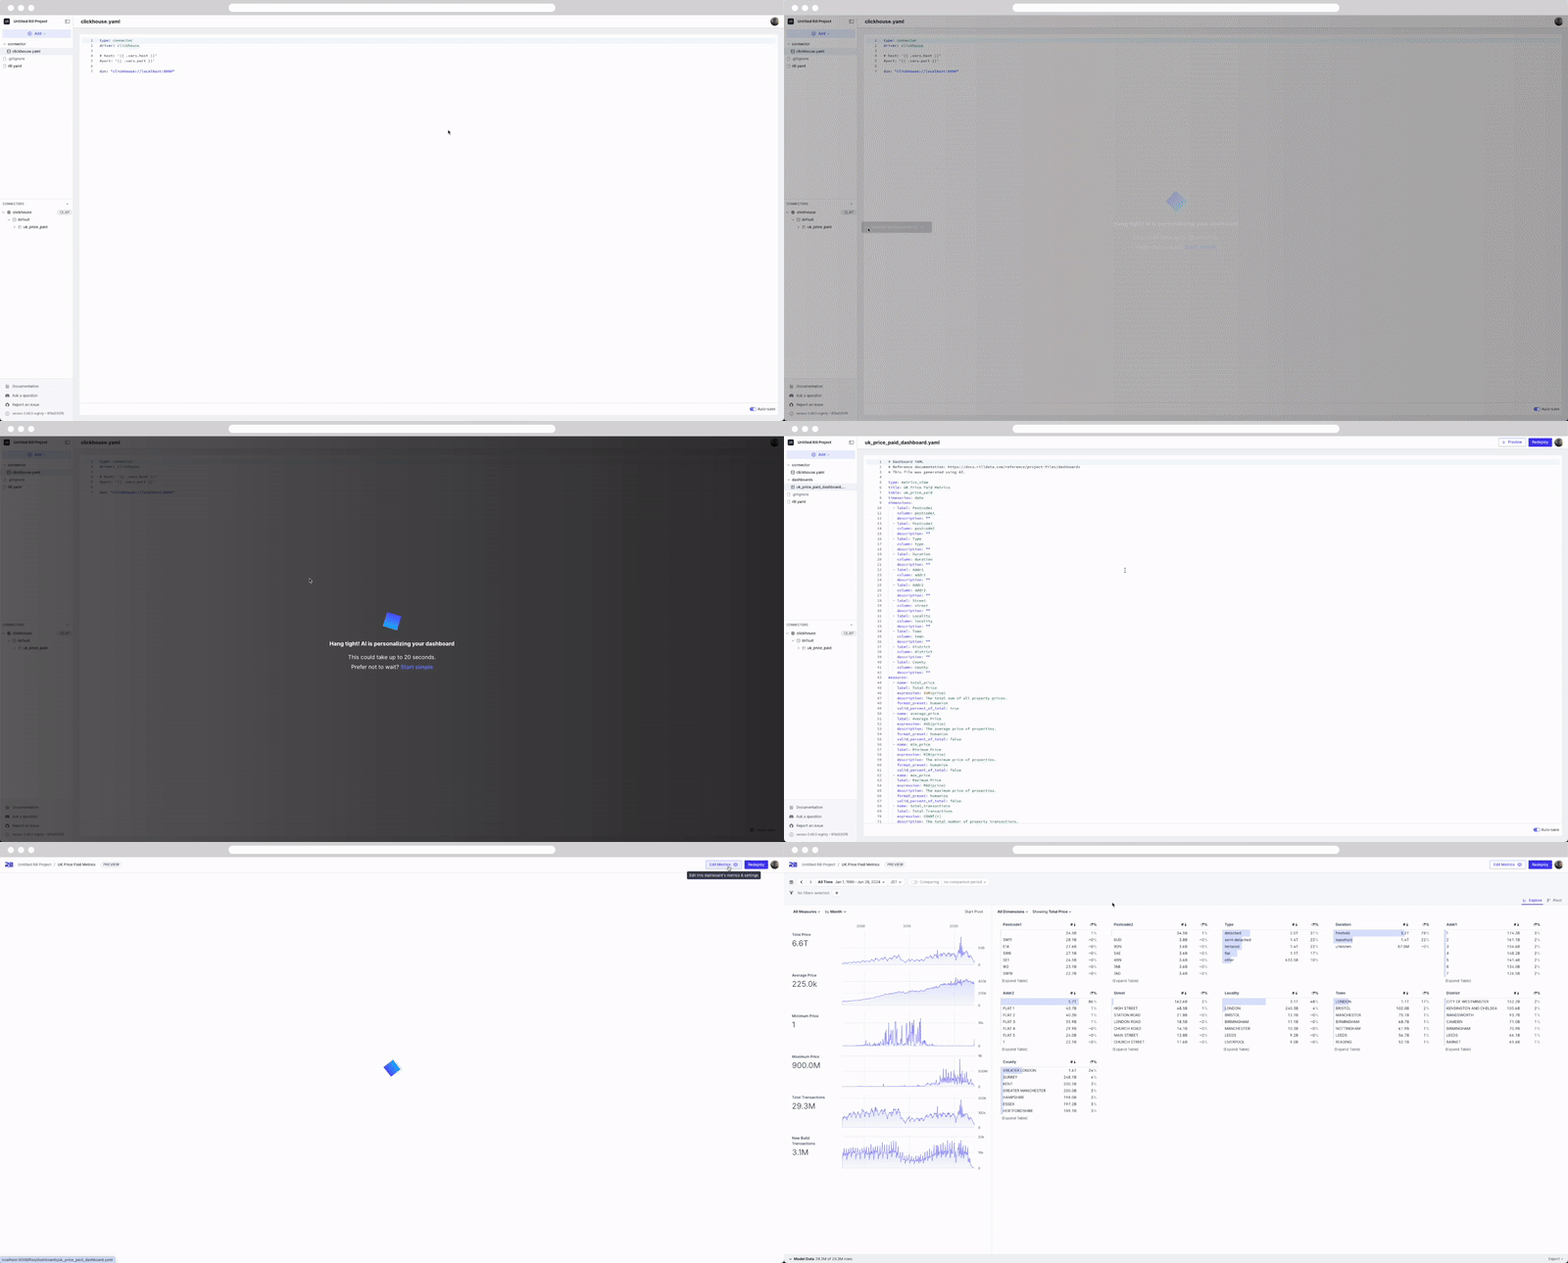
3. Create Metrics View Dashboard in Rill
Create the Metrics View.
If you noticed in the previous screenshot, we had a table called uk_price_paid. This is a dataset that is used in ClickHouse's Learning portal, so we thought it was fitting to go ahead and continue on this dataset.
In the case that you have not already added this table to your local or Cloud database, please follow the step on ClickHouse's site for the steps to do so!
Create metrics view
Let's create a metrics view based on the table via the Generate metrics via AI.

What are we looking at?
This is our metrics view, where we can define measures and dimensions to be used on dashboards.
# Metrics view YAML
# Reference documentation: https://docs.rilldata.com/reference/project-files/explore-dashboards
# This file was generated using AI.

version: 1
type: metrics_view

title: UK Price Paid Metrics
connector: clickhouse
table: uk_price_paid
timeseries: date

dimensions:
    ...

measures:
    ...
While we go into more details in our Rill Basics course and our documentation, let's go over it quickly.
timeseries - This is our time column that is used on as our x-axis for graphs.
connector - this is our manually defined ClickHouse connector
dimensions - These are our categorical columns that we can use on the dashboard to filter and slice;
measures - These are our numerical aggregates defined in the metrics layer. We can see functions such as MAX(), COUNT(), and AVG() used on the underlying table.