Create a New Metrics View
For reference on the following measures and dimensions, see our documentation on advanced measures
Let's Create a new Metrics View
As we have learned in the previous course, any modifications to the measures and dimensions need to be in the metrics_view.yaml. We can set up the new columns based on the previous editted model.
Let's create a new metrics view via the UI. It should be named advanced_metrics.yaml. Let's copy the contents from our old metrics view and make some changes.
First, we will want to change the table value to the new model name advanced_commits_model
table: advanced_commits___model # Choose a table to underpin your metrics
Add two new dimensions: directory path and commit_msg.
  - column: directory_path
    display_name: "The directory"
    description: "The directory path"
    name: directory_path

  - column: commit_msg
    display_name: "The commit message"
    description: "The commit description attached."
    name: commit_msg
Add four new measures:
SUM(total_line_changes),SUM(net_line_changes),SUM(num_commits),Percentage Code Deletion
On the SUM(net_line_changes) measure, add the following name: net_line_changes. While name is not required, this can be used by other components for reference, which will be discussed later.
Creating a measure in the metric-view
Like the SQL Model, our dashboards also use the same OLAP engine, and you can use aggregates or expressions to create new metrics. In our case, since we have the added_lines and deleted_lines measures, we can create a percentage of lines deleted measure.
SUM(deleted_lines) / (SUM(added_lines) + SUM(deleted_lines))
When to create measures in the SQL Model layer vs the metric-view layer? It depends.
Depending on the size of data, type of measure, and what you are calculating, you can choose either. Sometimes it would be better if you are dealing with a lot of data to front load the calculation on the SQL level so your dashboards load faster. However, the way OLAP engines work, you might get incorrect data by doing certain calculations in the SQL level. You'll have to test and see which works for you!
Working Metrics View
# Metrics View YAML
# Reference documentation: https://docs.rilldata.com/reference/project-files/metrics_views

version: 1
type: metrics_view

table: advanced_commits_model # Choose a table to underpin your metrics
timeseries: author_date # Choose a timestamp column (if any) from your table

dimensions:
- column: directory_path
  display_name: "The directory"
  description: "The directory path"
  name: directory_path

- column: filename
  display_name: "The filename"
  description: "The name of the modified filename"
  name: filename

- column: author_name
  display_name: "The Author's Name"
  description: "The name of the author of the commit"
  name: author_name

- column: commit_msg
  display_name: "The commit message"
  description: "The commit description attached."
  name: commit_msg

measures:
- expression: "SUM(total_line_changes)"
  display_name: "Total number of Lines changed"
  description: "the total number of lines changes, addition and deletion"
  name: total_line_changes

- expression: "SUM(net_line_changes)"
  display_name: "Net number of Lines changed"
  description: "the total net number of lines changes"
  name: net_line_changes

- expression: "SUM(num_commits)"
  display_name: "Number of Commits"
  description: "The total number of commits"
  name: num_commits

- requires: [total_line_changes, net_line_changes]
  expression: "(SUM(deleted_lines)/(SUM(deleted_lines)+SUM(added_lines)))"
  display_name: "Code Deletion Percent %"
  description: "The percent of code deletion"
  format_preset: percentage
Create the Explore dashboard
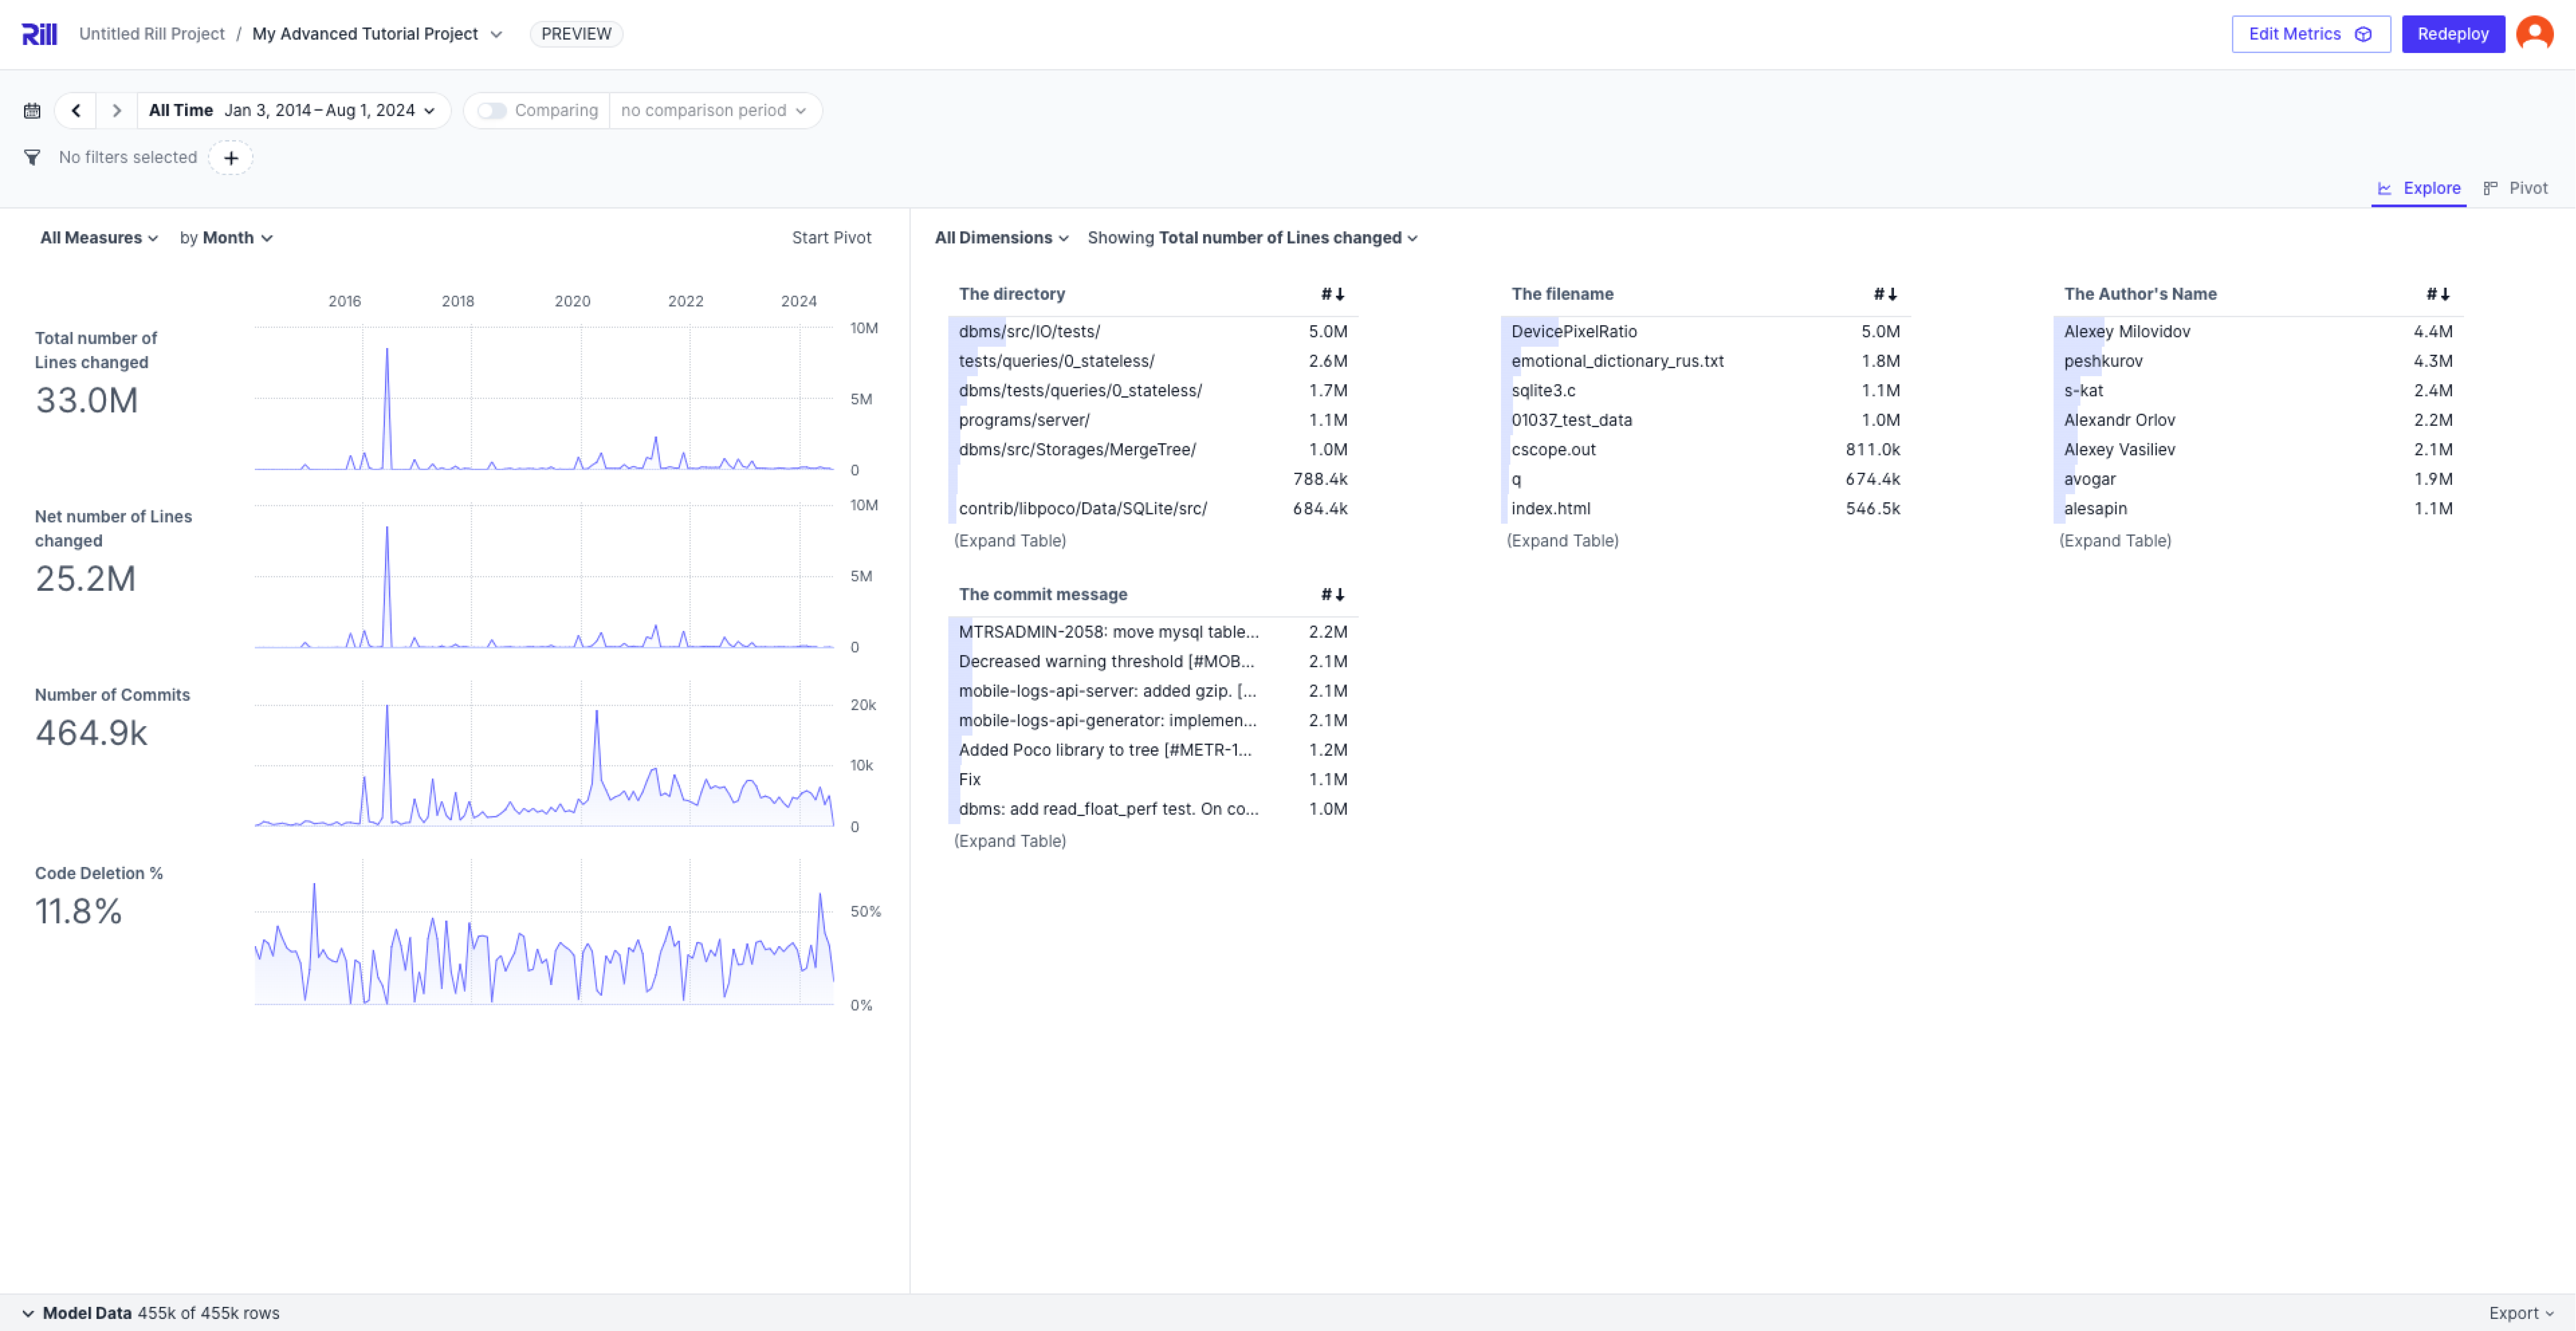
Similarly to the Basics course, we can create an explore-dashboard on top of this metrics view by selecting Create explore. You're preview should look something like the below!

Along with the dimensions and measures, you can define theme:, time zones, time ranges, and security policies. Feel free to test by uncommenting the parameters and seeing how it changes the explore dashboard.
# Explore YAML
# Reference documentation: https://docs.rilldata.com/reference/project-files/explores

type: explore

title: "advanced_metrics_view dashboard"
metrics_view: advanced_metrics_view

dimensions: '*'
measures: '*'

# theme: theme.yaml

#time_ranges:
#  - PT15M // Simplified syntax to specify only the range
#  - PT1H
#  - PT6H
#  - P7D

#time_zones:
#  - America/New_York

#security:
#  access: "{{ .user.admin }} AND '{{ .user.domain }}' == 'rilldata.com'"